Since the Fed intimated that it would begin tapering QE in May 2013, U.S. financial markets have experienced several “taper tantrums”. And since QE-balance sheet expansion ended in October 2014, the major stock market indices have experienced two “rate refluxes” (my term) – the most recent being an 11.8% stock market correction fall from December 16th 2015, the day after the interest rate hike, to February 11th, 2016 low close.
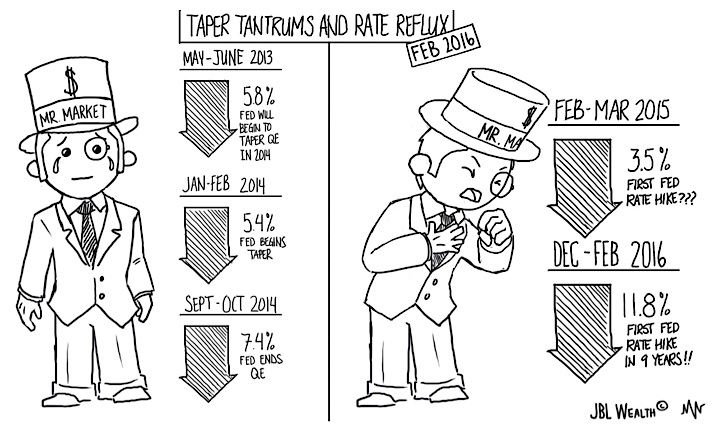
Of course there were other forces at work during the second stock market correction since May 2015 highs, such as China growth worries, foreign reserves, and hedge fund managers and blogs estimating Chinese banks have between 10% and 20% net profit loss potential on over $30 trillion in assets, dismal global trade data, European banks acting like its 2008, their U.S. counterparts not faring too much better, and the possible loss of confidence in the abilities of the largest global central banks as discussed in my last post – Respect Our Stimuli!
But, on a daily basis the price of crude oil has been the tail that wags the 2016 market dog.
On the afternoon of February 11th, with West Texas Intermediate crude oil setting a new near 13-year low in the mid-20s and the S&P 500 hitting 1810.1, the lowest intraday level in 28 months, it was fortuitous to say the least that the host of the 2018 FIFA Club World Cup came in with a kick save. The United Arab Emirate’s oil minister said that “OPEC is ready to cooperate on a production cut.” Crude oil prices closed the session near its highs, the S&P 500 bounced 20 points (over 1%) instantaneously and the stock market correction was over – at least for now. And, then several days later Saudi Arabia and Russia agreed to an oil production “freeze” at January 2016 levels and the following day Iran “supported” the deal.
In the six trading sessions since the February 11th pre-UAE kick save low, crude is up 15%+ and the S&P 500 is up 7.5%, with immediate resistance at the 50-day simple moving average around 1951 (S&P futures touched its 50-day but cash failed to do so Monday).
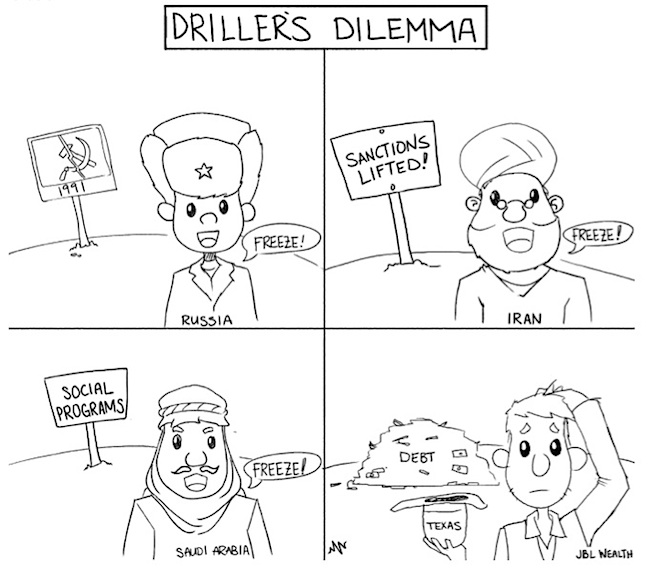
Oil pricing of course faces a Driller’s Dilemma of sorts in this latest “agreement”. If oil rises to $40 or above, who is incentivized to cooperate? The late 1980s collapse in oil prices did in the Soviet Union (and Putin remembers that), Saudi Arabia’s budget to support social programs is hemorrhaging, the ban on Iranian oil exports was just lifted, and Texan oilmen weren’t part of the “deal” and have to pay their lenders.
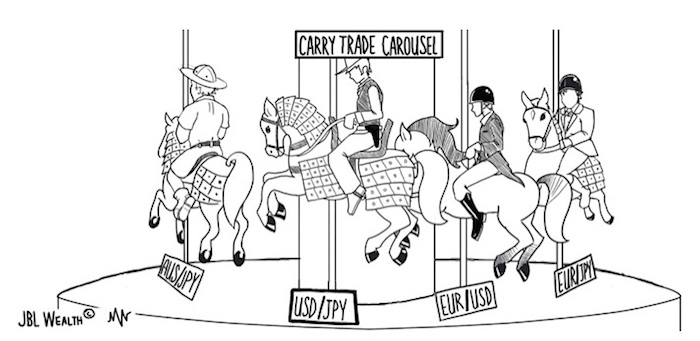
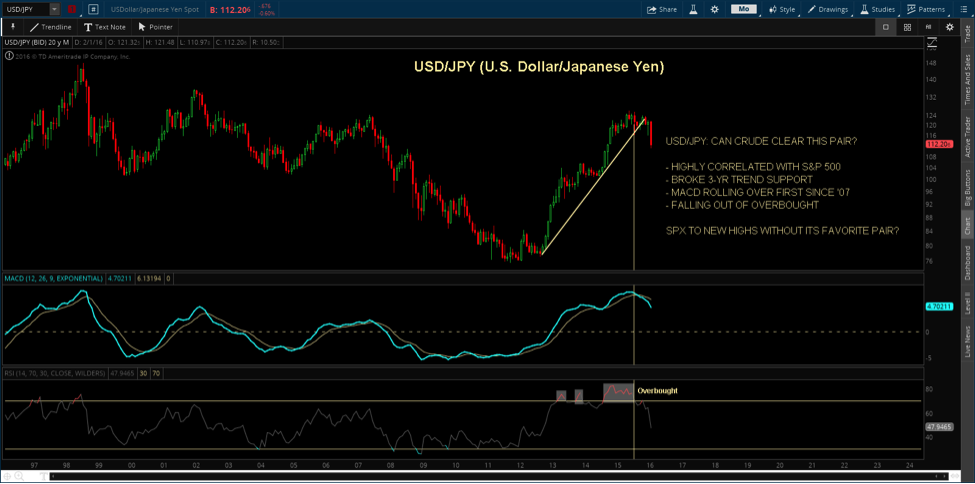
Additionally, a divergence has opened up between the S&P 500 and the USD/JPY pair propellant that has driven the S&P 500 higher since 2012. While the S&P is up 7.5% off the February 11th intraday lows, the USD/JPY carry trade pair is up less than 2% as the Yen continues rising in a risk off unwind. The USD/JPY pair is sounding a warning for global stock markets that even “mighty” $30-$40 crude may not be able to overcome for very long.
No doubt, the price action (and news cycle) will be interesting in the weeks ahead. March brings with it all major central banks making decisions. But larger questions loom:
- Have they lost control of the big wheel of Price Discovery?
- Will this stock market correction morph into a bear market… or will volatility bounce markets around long enough for another rate reflux?
- Has crude put in a bottom and how far can it carry markets?
- How long will U.S. equities be able to ignore the risk off signal given by the USD/JPY pair, not to mention Treasuries?
- How far can these countertrend rallies take equities in the midst of an “industrial” and “profits” recession?
If you have the answers, call the West Texas oilmen, they need some swings. As for me and mine, we will let Trend guide the way.
USDJPY Currency Pairs Chart
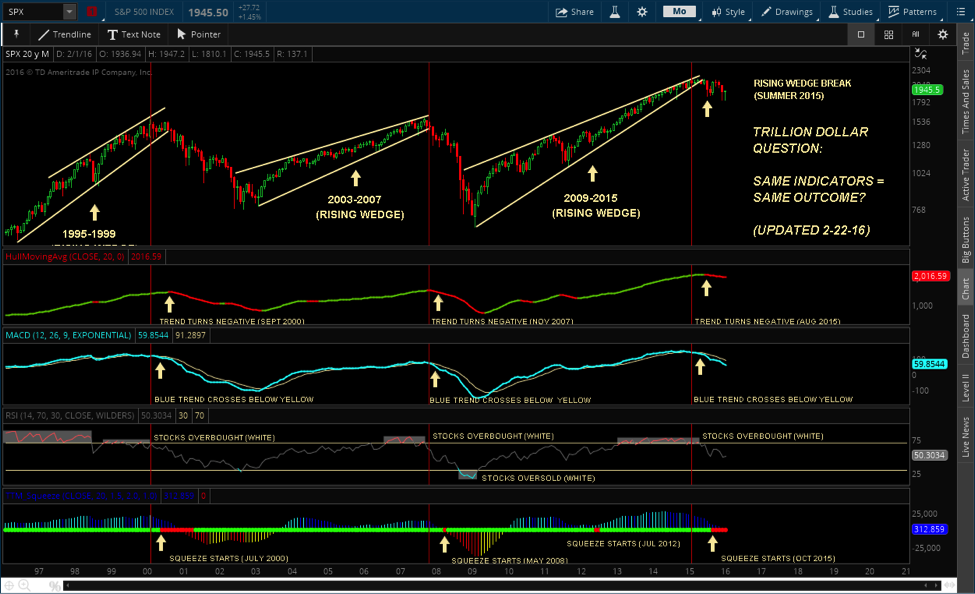
S&P 500 Index Chart
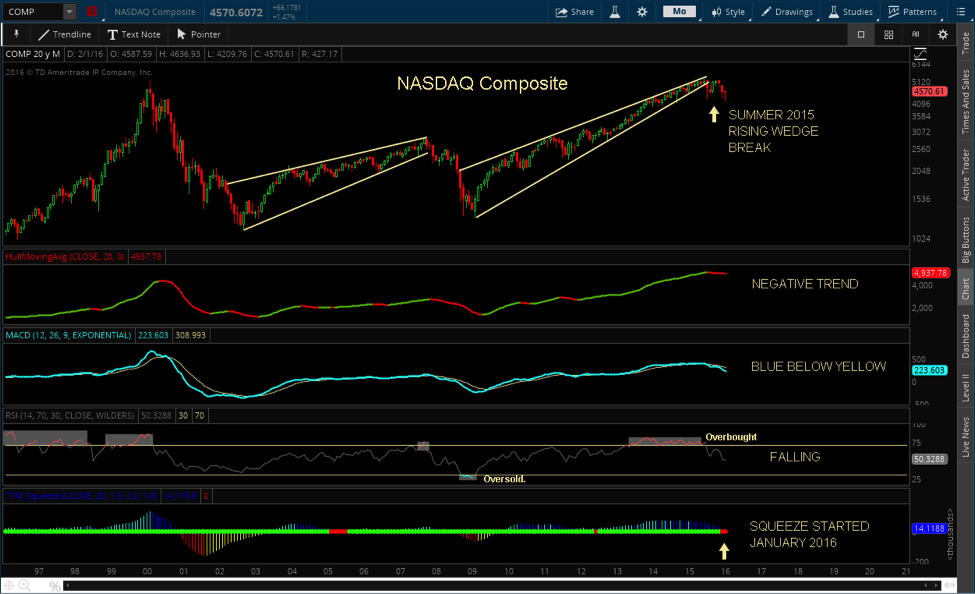
NASDAQ Composite Chart
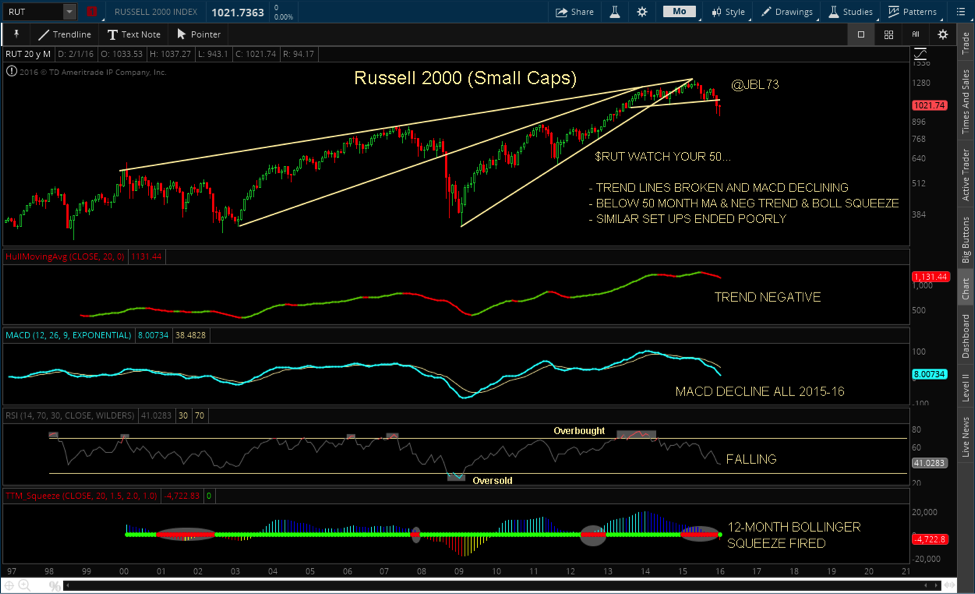
Russell 2000 Chart
Thanks for reading. You can visit our site to learn more about our TREND and MOMENTUM strategies.
Disclaimer from the author:
JBL WEALTH ADVISORY IS A REGISTERED INVESTMENT ADVISER. INFORMATION PRESENTED IS FOR EDUCATONAL PURPOSES ONLY AND DOES NOT INTEND TO MAKE AN OFFER OR SOLICITATION FOR THE SALE OR PURCHASE OF ANY SPECIFIC SECURITIES, INVESTMENTS, OR INVESTMENT STRATEGIES. INVESTMENTS INVOLVE RISK AND UNLESS OTHERWISE STATED, ARE NOT GUARANTEED. BE SURE TO FIRSTCONSULT WITH A QUALIFIED FINANCIAL ADVISER AND/OR TAX PROFESSIONAL BEFORE IMPLEMENTING ANY STRATEGY DISCUSSED HEREIN. OPTIONS STRATEGIES ENTAIL DIFFERENT FORMS OF RISK. COVERED CALL WRITING MAY LIMIT THE UPSIDE POTENTIAL OF OUTRIGHT OWNERSHIP OF A SECURITY IN A GENERALLY RISING MARKET. SELLING PUTS COULD REQUIRE AN INVESTOR TO PURCHASE A STOCK AT A MUCH HIGHER PRICE THAN THE PREVAILING PRICE OF THE STOCK IN A MARKET SELLOFF. EXAMPLES PRESENTED ASSUME THE ABILITY TO CONSISTENTLY SELL OPTIONS AT A SPECIFIC PREMIUM AND MAINTAIN OWNERSHIP OF THE STOCK IN A COVERED CALL SCENARIO OR NOT HAVE TO PURCHASE STOCK IN A CASH SECURED SELL PUT SCENARIO. ALL RETURNS ARE NET OF MANAGEMENT FEES.
Past performance of Trend and Momentum models does not predict future performance. All returns shown are with dividends and distributions reinvested. Any benchmark chosen may or may not reflect the same markets or volatility of the back tested portfolio designed and may just be a representative benchmark of a large capitalized stock index. Index returns include dividend reinvestment. Graphs in and of themselves are not predictors of future price movements. All returns shown are net returns and reflect the deduction of the management fees of JBL Wealth Advisory. Back tested modeling has inherent limitations as models do not represent the results of actual trading using client assets but results are achieved by the use of a retroactive application of a back tested model that was designed with the benefit of hindsight. The results do not represent the returns that any investor achieved. Back testing allows the security selection methodology to be adjusted until past returns are maximized. Actual client performance may differ significantly from back tested performance.
Twitter: @JBL73
Any opinions expressed herein are solely those of the author, and do not in any way represent the views or opinions of any other person or entity.


 Testing Important Price Support")


