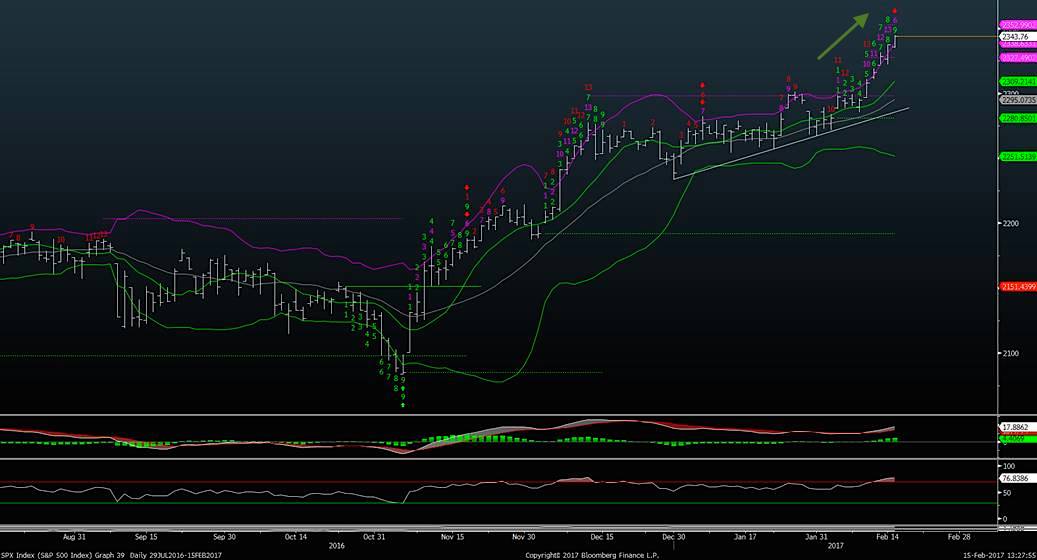
The market continues to push upwards, though with less breadth and magnitude than seen in recent days. Today, the S&P 500 (INDEXSP:.INX) is driving closer to 2350, and the Dow Jones Industrials (INDEXDJX:.DJI) 20,600.
While the Media talked about indices scaling further into new highs territory (which was certainly true), though, prices have registered an official “8 count’ in this current Demark based sell setup, and look poised to register a 9 today.
These sell setups may limit upside from here. As well, they imply that a reversal is imminent in the coming days. Note that the Emerging Markets ETF (NYSEARCA:EEM) and the VIX Volatility Index (INDEXCBOE:VIX) are also showing completed Demark counts as of Tuesday’s trading – this suggests that reversals should be imminent. In plain English, the counter-trend my methodology that makes up at least part of the thinking of why equities will need to consolidate gains and selloff in the near-term looks to be now in place.
Patience is still required as we await confirmation.
The Financials Sector (NYSEARCA:XLF) – We’ve seen Financials lead the market higher as the breakout in the sector ETF (XLF) has extended ever higher. This is a bullish sign on an intermediate-term basis (3-4 months), yet the group is overbought near-term, similar to the broader market. However, this week’s move is noteworthy given that Financials make up the bulk of the gains post-Election and have broken out once more after a sideways consolidation. This constructive “flag” pattern should help to carry the group ever higher in the weeks ahead, despite the fact that momentum HAS gotten overbought. In my opinion, counter-trend sell signals for Financials are premature, and the group still lies 22% off all-time highs. Additionally, it’s important to point out that the Financials Sector (XLF) makes up nearly 15% of the S&P 500, so breakouts in this group are likely to serve as a tailwind for stocks in the next few months.
Therefore, while near-term selloffs are growing increasingly likely, they should prove to be short-lived given the resiliency of this sector. And pullbacks should provide for better suited buying opportunities…
Bottom line, it looks like a time to be very selective about what to buy and initiate as longs. As well, it’s wise to be on the lookout for trend reversals this week (where prices push higher early on in the day, only to close down near the lows for the day).
S&P 500 Index
Gains this week have lifted prices to overbought levels, but momentum showed some definite signs of tiring, diverging from price in making a lower high which is a key warning sign that this lift may be coming to an end sooner than later. Trading short positions and/or hedges may be the way to go. I’m selling into strength here, and looking for signs of a price reversal in the days ahead.
Note that you can catch more trading ideas and market insights over at Newton Advisor. Thanks for reading.
Twitter: @MarkNewtonCMT
Any opinions expressed herein are solely those of the author, and do not in any way represent the views or opinions of any other person or entity.


: Showing Some Signs of Emerging Strength")
