Today’s large gap up in the stock market indices poses some great questions, the biggest one being: Should I buy the gap, or should I wait to see where things go?
You don’t want to chase the stock market, but you don’t want to miss out either.
You can never be 100% certain of what will happen, but you can apply solid risk methods to help you decide whether you want to put your capital at stake.
Since we have been keeping a close watch of the major stock indices, we will use the S&P 500 (SPY) and Russell 2000 (IWM) to gauge risk on individual trades based off the daily charts.
There are many ways traders manage their risk. Today I’m going to show you a simple way to gauge risk by looking at a chart without diving into any deep calculations.
This is best used while scanning through charts to quickly see if there you have good risk to reward before you begin to look at it more closely for a trade entry.
Let’s start with a simple risk parameter that whatever price we risk to we should at least make double that amount.
Having a standard like this helps us know where we expect a stock’s price to go based off what we’re risking.
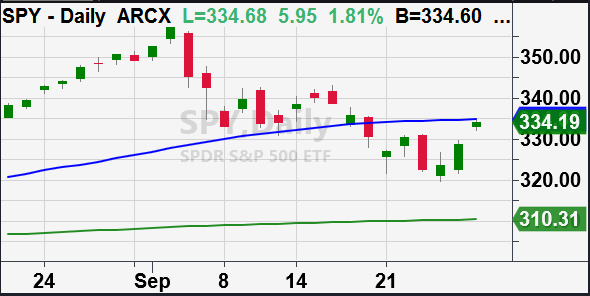
Above is the S&P 500 ETF (SPY). For this example, let’s say I wanted to risk to the most recent low of 319.80 on September 24.
I don’t believe it will trade lower than that price level. If I buy around 334, I’m risking roughly 14 dollars. I should then expect to make double that, which would be $28. In other words, I want to see SPY get to 362 before I reach a profit target.
Essentially, with all-time highs made on September 2nd at 358, do I think it will reach that price and higher? Possibly, but that is another story!
Of course, you can trade for a different timeframe, day or 2-3-day swings. However, the risk price may be different, but the expectation of 2:1 should be about the same.
Let’s look at another one.
Here we have the Russell 2000 ETF (IWM). This time I want to take a trade with my risk being 144.94 the 200-DMA.
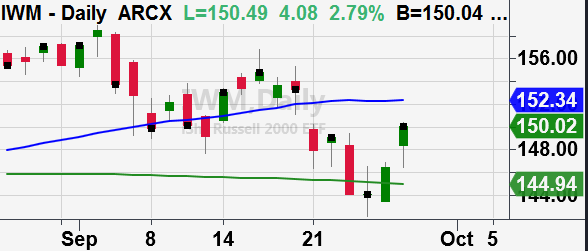
I would buy at 150 with a risk $5.06. Now we double our risk so 5.06 + 5.06 is 10.12.
This means I would expect IWM to go to 10.12 + 150. Which is 160.12 This means IWM is going to have to clear through all that resistance from 154-160.
Knowing this you can begin to look at charts and quickly gauge where you would risk to and if you expect something to reach a price level based on that risk. This is also called, “look left to go right.”
Sometimes you will realize that where you want to risk leads you right into some large resistance areas.
All around this will help you find trades that can be more favorable or entice you to trade in smaller timeframes.
This is especially important right now, given that the markets are more volatile and could become even more so with the election coming up.
S&P 500 (SPY) Stopped right before the 50-DMA 330 Key Support.
Russell 2000 (IWM) Support 142. Cleared the 10-DMA Resistance at 152
Dow (DIA) Watching for second day close over 50-DMA at 275.69
Nasdaq (QQQ) Watching for second day close over 50-DMA at 274.03
KRE (Regional Banks) Could be a reversal bottom with confirmation over 36
SMH (Semiconductors) Clean break over resistance of 170. Needs to clear 174.74
IYT (Transportation) Cleared 202, needs to hold.
IBB (Biotechnology) Over 135 looks great
XRT (Retail) Has to clear over 50-DMA and hold.
Twitter: @marketminute
The author may have a position in the mentioned securities at the time of publication. Any opinions expressed herein are solely those of the author, and do not in any way represent the views or opinions of any other person or entity.

: Creating Bullish Divergence?")

: Creating Bullish Divergence?")


