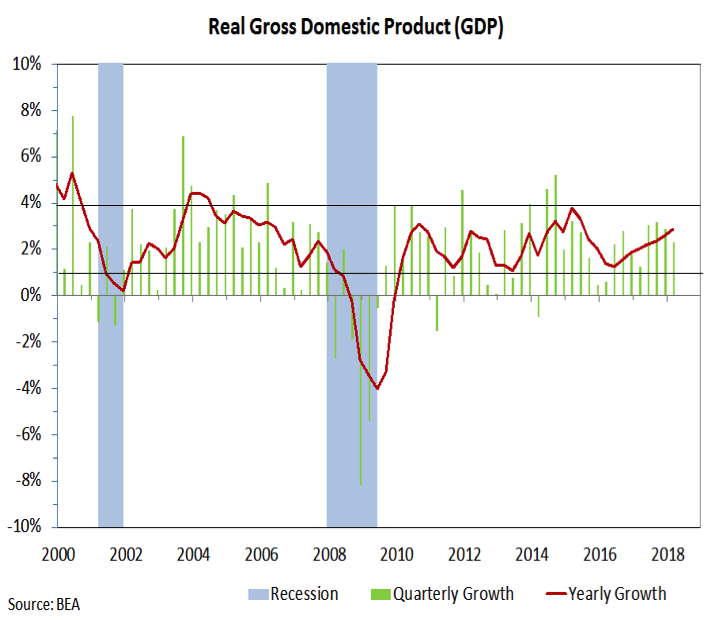
Initial jobless claims have been at their lowest levels since the 1960s, the yield curve has flattened but not inverted, and state-level economic conditions are not consistent with a high risk of recession.
That latest look at GDP:
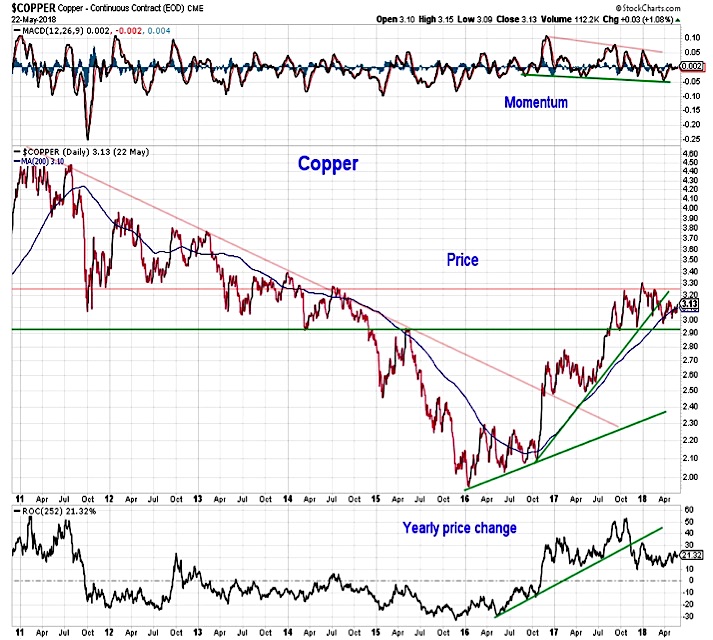
For both evidence of economic vitality and hints of the path forward for bond yields, we watch the price of copper. While its forecasting abilities may be overstated, it can provide timely confirmation of evidence received elsewhere. Just as German Bund yields have not confirmed the most recent rise in U.S. Treasury yields, Copper prices have withheld confirmation as well. Copper prices rose steadily from early 2016 though early 2018, confirming the evidence of economic acceleration and the rise in Treasury yields.
More recently, however, Copper has been in a consolidation mode. If growth is going to accelerate and yields are going to have a sustainable path higher, we would expect to see copper resume its trend higher.
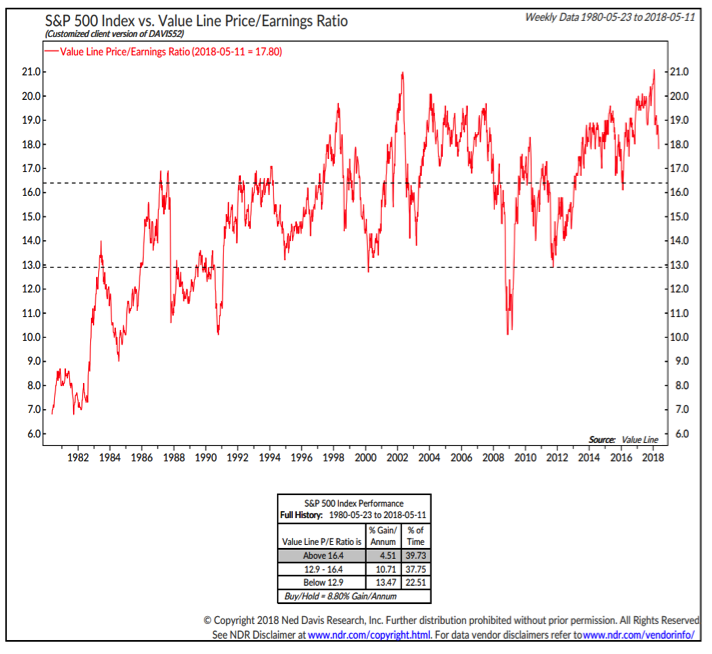
Valuations Remain Bearish. Improving economic growth and the effects of recent tax reform combined to support strong corporate results in the first quarter. Companies in the S&P 500 combined to show 8% top-line growth and better than 20% bottom-line growth in the first quarter. These were the best growth rates in nearly a decade. Even with the elevated expectations coming into the reporting season, 80% of companies were able to provide positive earnings surprises. With the first quarter in the books, the stock market’s attention turns to the remaining quarters of the year and whether companies can continue to deliver strong results. Of particular concern from our perspective will be the impact on margins of rising labor and energy costs. Earnings strength in the first quarter came on record profit margins.
There is not yet evidence that Q1 strength is providing a tailwind for estimates in coming quarters. The earnings tailwind is important right now because valuations remain elevated, even when considering a balance between trailing and expected earnings (which is what is provided in the Value Line Price/Earnings Ratio). One underlying positive in the stock market this year is that price volatility has come at a time when earnings are rapidly growing. If this continues, it could allow for valuations to quickly move back toward more historically normal levels and relieve one of the more significant longer-term headwinds for stocks. While this has not yet occurred, valuations are, for the first time in quite a while, at least heading in a more constructive direction.
We are, for now, keeping investor sentiment as bullish. The pattern among the short-term indicators this year has been that pessimism quickly emerged in periods of volatility and stock market weakness, while optimism returned as stocks stabilized and moved off of their lows. A change in this pattern (a sell-off that does not lead to pessimism or a rally that does come with optimism) could provide evidence about the ultimate resolution of the trading range within which stocks find themselves.
We are more cautious on sentiment from a longer-term perspective. Optimism has pulled back from generational excesses. But it is hard to construct an argument based on this data that a meaningful level of longer-term pessimism has emerged.
Seasonal Patterns and Trends have turned bearish. History shows that the two quarters ahead of mid-term elections tend to be the weakest six-month stretch for stocks of the entire four-year presidential election cycle. With control of at least one house of Congress up for grabs and the geo-political policy backdrop as uncertain as ever, there seems to be little reason to argue against the historical pattern at this point. Small-cap stocks tend to be especially hard-hit heading into mid-term elections, falling even faster than their large-cap counterparts. This is one reason we have viewed recent new highs from small-caps with some degree of skepticism.
Another reason is that even as the small-cap indexes have been making new highs, up to one-third of the stocks within the indexes have been 20% or more below their individual highs.
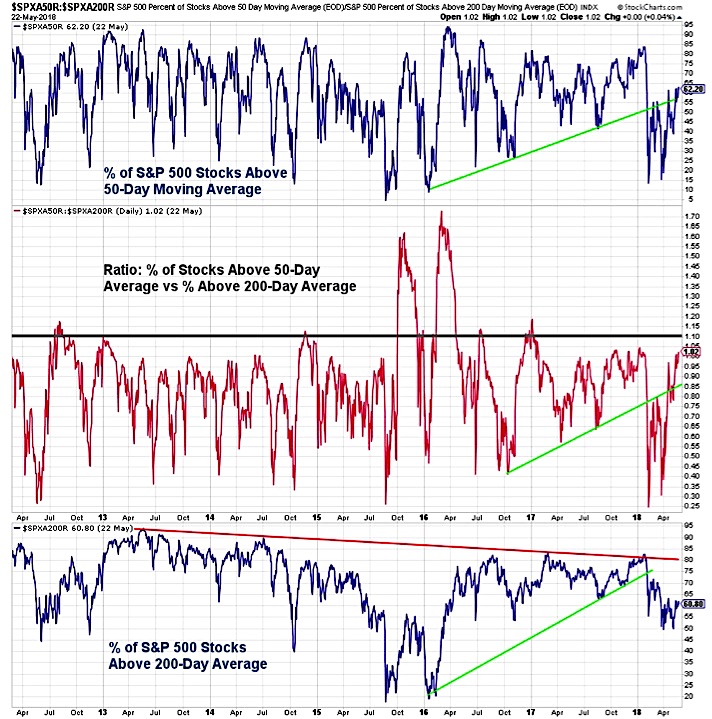
This supports our view that Breadth is still neutral. Various advance/decline lines have made new highs, but other measures of breadth have lagged. The percentage of S&P 500 stocks trading above their 50-day averages and 200-day averages do not show broad strength and the percentage of industry group in up-trends has yet to show a return to strength.
Most importantly, when the market is ready to move out of the consolidation phase it finds itself in, we expect it will signal this with the type of buying pressure that has historically led to bullish breadth thrust signals. Until then, we are likely to maintain a relatively cautious stance.
Thanks for reading.
Twitter: @WillieDelwiche
Any opinions expressed herein are solely those of the author, and do not in any way represent the views or opinions of any other person or entity.


