Wow, just wow. The U.S. stock market is resilient.
Simple as that.
Every pullback gets bought and no matter how many negative news headlines, stocks just continue higher.
That is why technicians (like myself) advocate for traders to follow “price”. The goal is to capture a portion of each trend move and the best way to do that is to tune out the noise (and news) and simply follow the price trend. Today’s set of charts provides insights surrounding the current up-trend (and warns of short-term caution).
Note that the following MarketSmith charts are built with Investors Business Daily’s product suite.
I am an Investors Business Daily (IBD) partner and promote the use of their products. The entire platform offers a good mix of technical and fundamental data and education.
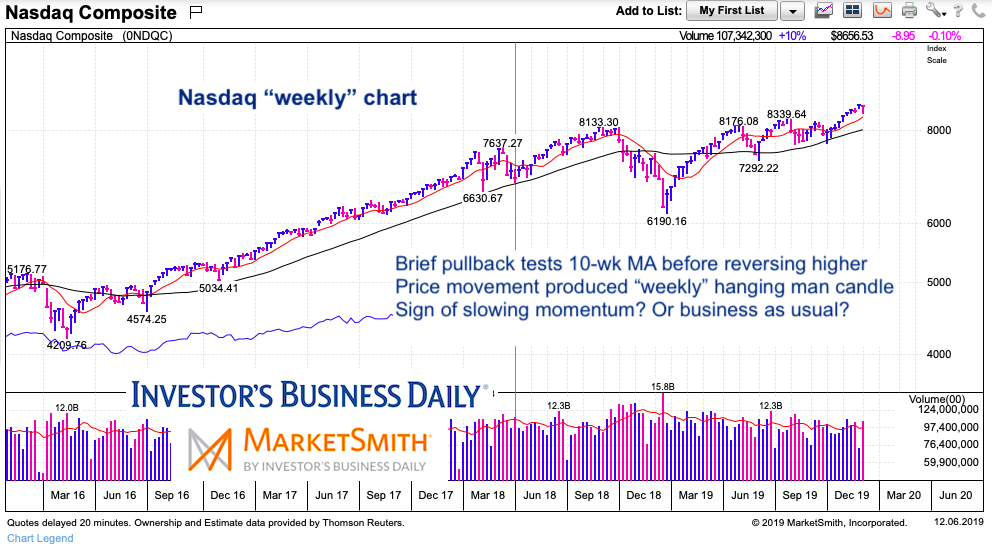
Nasdaq “weekly” Chart
Every chart looks similar and makes the same point… so we’ll highlight it here and let the others serve as similar examples.
The first chart is of the Nasdaq Composite INDEXNASDAQ: .IXIC which has been a leader of the bull market. Tech stocks pulled back sharply to begin the week before reversing high and erasing a majority of the losses. That said, this price action produced a “weekly” hanging man candlestick – this can serve as a sign of impending exhaustion.
Understanding this, bulls need to be on alert for additional selling. Any follow-through selling would be bearish and change the stock market stance to “neutral”.
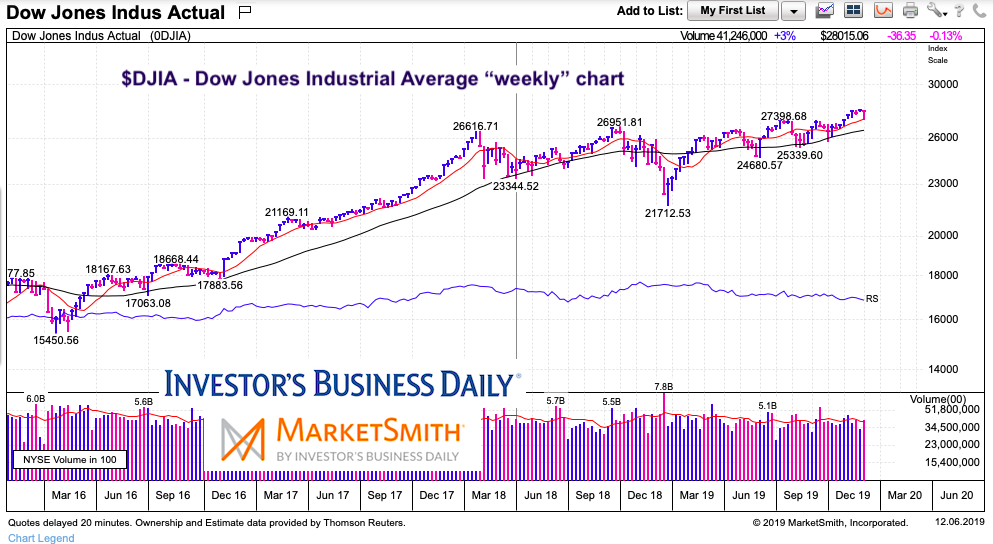
Dow Jones Industrial Average “weekly” Chart
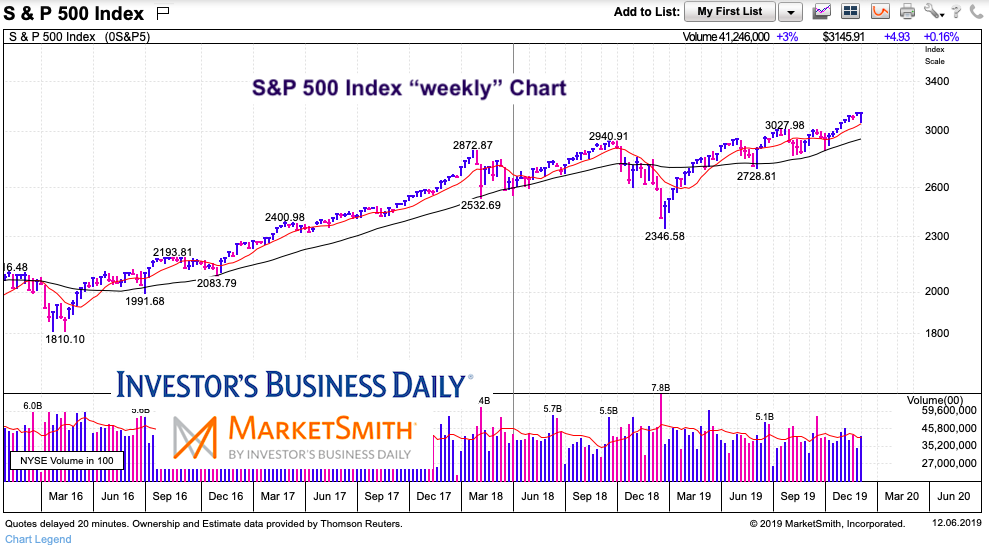
S&P 500 Index “weekly” Chart
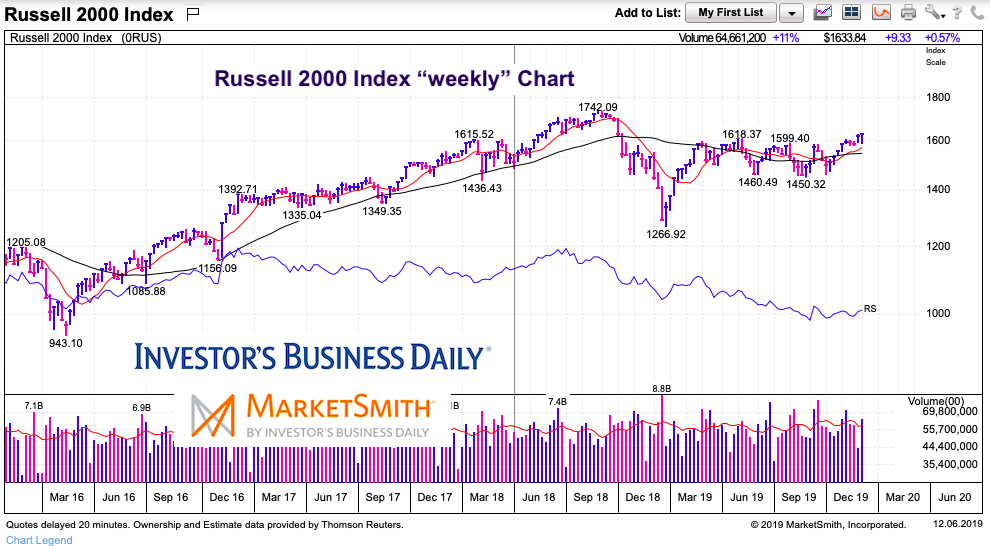
Russell 2000 “weekly” Chart
Twitter: @andrewnyquist
The author may have a position in mentioned securities at the time of publication. Any opinions expressed herein are solely those of the author, and do not in any way represent the views or opinions of any other person or entity.

: Creating Bullish Divergence?")

: Creating Bullish Divergence?")


