The recovery following the March stock market crash is in its 5th week.
Considering all the uncertainty and lingering concerns, it certainly feels like longer.
As most active investors know, price always wins the day. The market is never wrong, only those that stay “wrong” for too long. I remain long index ETFs (but with hedges). We are clearly still in an uncertain phase so being able to articulate your plan and exit strategy is important. But I digress…
Today, I share two charts of sectors that have been lagging during the recovery rally: Small Cap stocks (The Russell 2000 – $IWM) and Financial stocks (The Financial Sector – $XLF). Both are playing catch up early this week and are near breakout resistance levels worth watching. As with most of my posts, this is but a nugget of information…
Note that the following MarketSmith charts are built with Investors Business Daily’s product suite.
I am an Investors Business Daily (IBD) partner and promote the use of their products. The entire platform offers a good mix of technical and fundamental data and education.
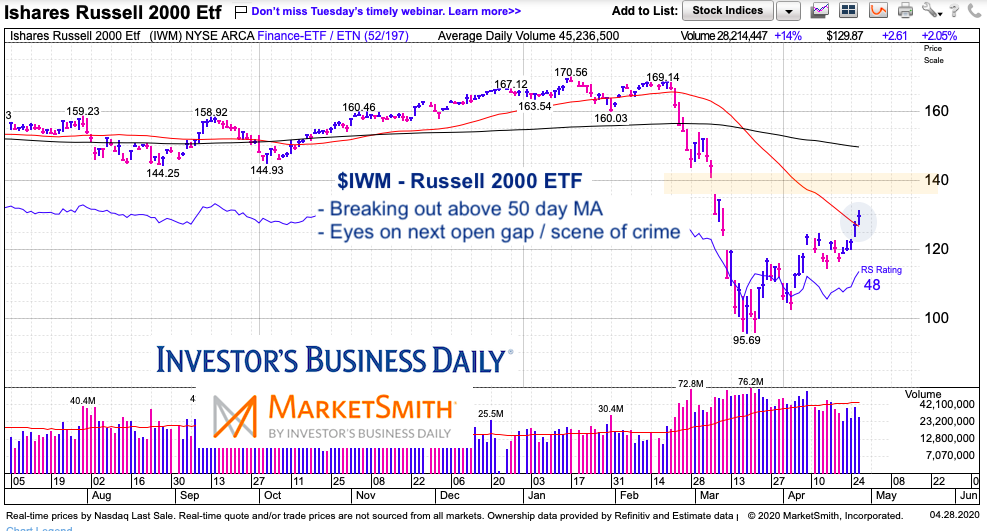
$IWM Russell 2000 ETF Chart
The small caps have been seriously lagging as they bear the brunt of the economic hit from COVID-19. But the Russell 2000 is trying to play catch-up this week… barring an abrupt reversal, bulls could push this back up to the next “scene of the crime”. While there could be opportunity short-term, the technical backdrop is not good intermediate-term (with the 50 and 200 day MAs declining).
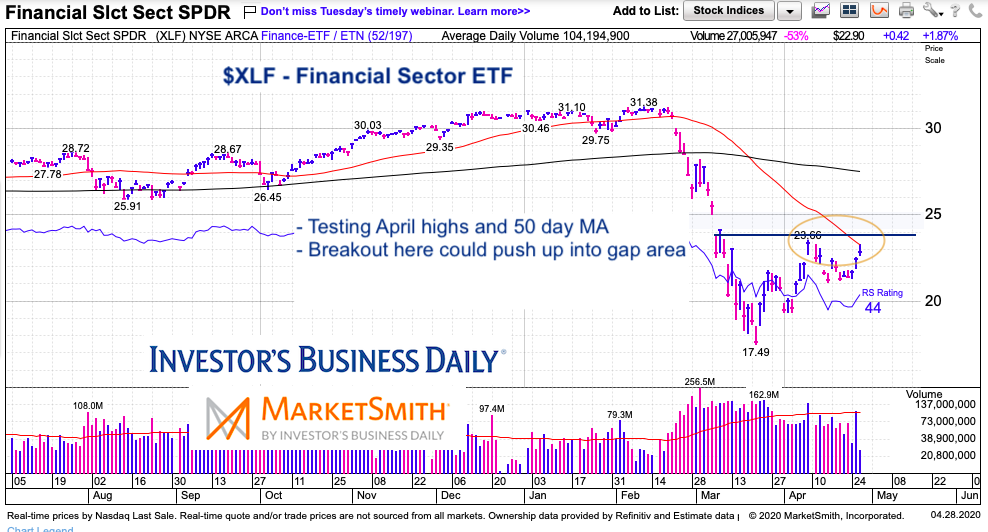
$XLF Financial Sector ETF Chart
As Todd Harrison says, “as go the piggies, so goes the poke”. The financial sector is an important part of the market and economy… so bulls are always happy to have them involved with a rally. They have been lagging badly, a thorn in the bulls side.
Currently, the XLF is testing its April highs and 50 day moving average at the same time. A breakout here would be a shot of short-term good news. Stay tuned.
Twitter: @andrewnyquist
The author may have a position in mentioned securities at the time of publication. Any opinions expressed herein are solely those of the author, and do not in any way represent the views or opinions of any other person or entity.


