$QQQ – Daily/Weekly and Open Interest:
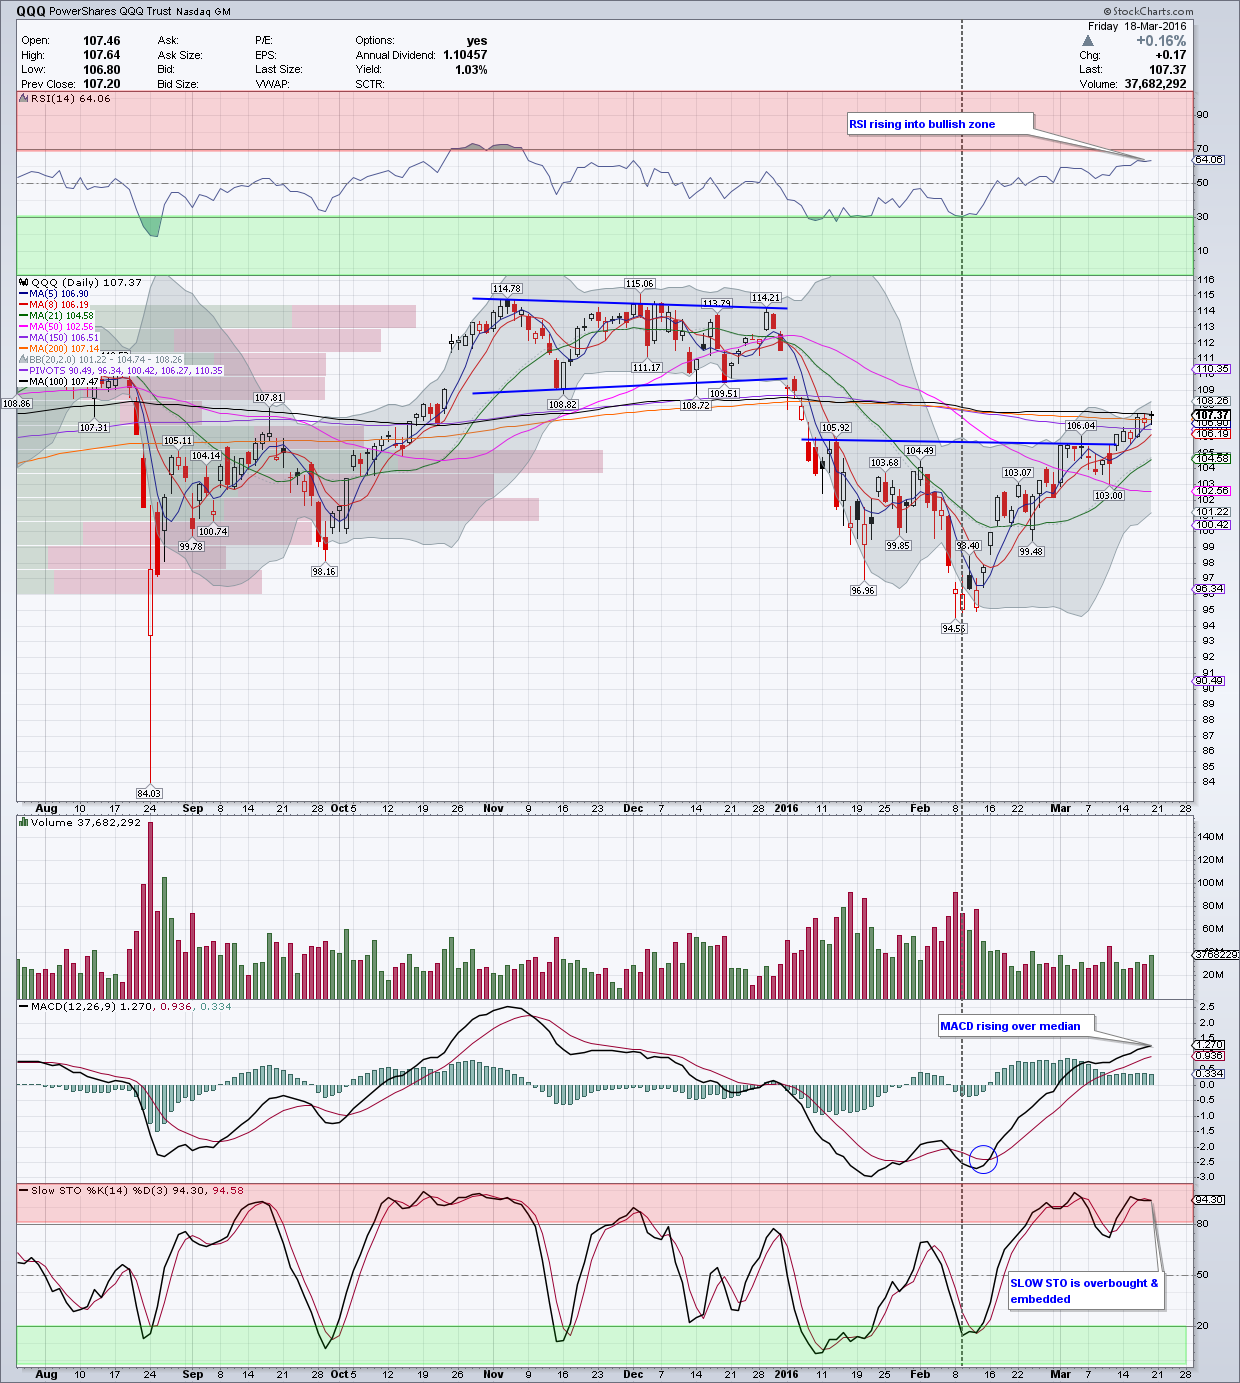
On a Daily timeframe, $QQQ moved higher after consolidating a bit and ended the week just over its 200 SMA. Normally on the first attempt, there is a potential for a pullback or consolidation around the 200 SMA before re-launching over it and I would expect some kind of a move like that early next week. Many participants can definitely get excited with the HangingMan type candlestick and if confirmed, can have a quick move lower.
From a momentum indicators standpoint, RSI is rising and is in bullish zone, nowhere close to being overbought on this timeframe. MACD is rising and is now over its median. Slow STO though is overbought and embedded and some consolidation or pullback here can be expected. Bollinger bands are opening up nicely and that bodes well for higher prices.
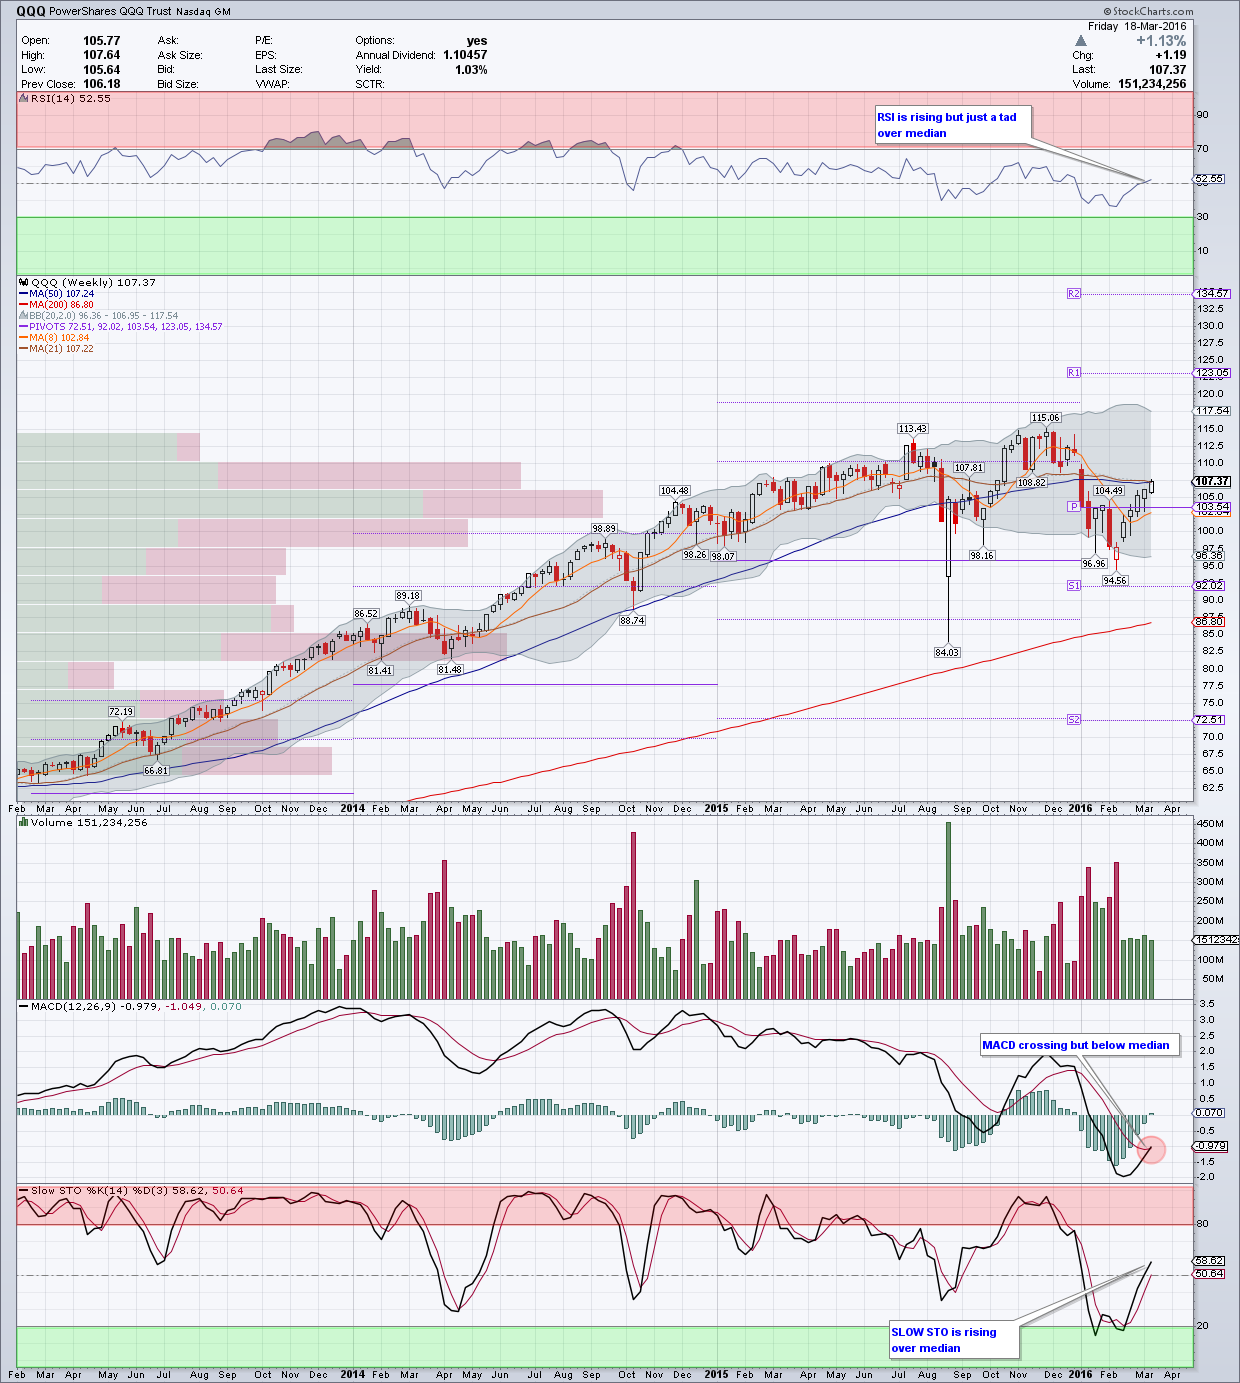
On a Weekly timeframe, $QQQ like $SPY has 5 successive candles higher. This is quite bullish in nature. From a momentum indicator standpoint, RSI is rising but just over its median while MACD has made a bullish cross and is starting to rise. It is below its median as of now. Overall constructive action here too. Expect some consolidation with continued higher prices.
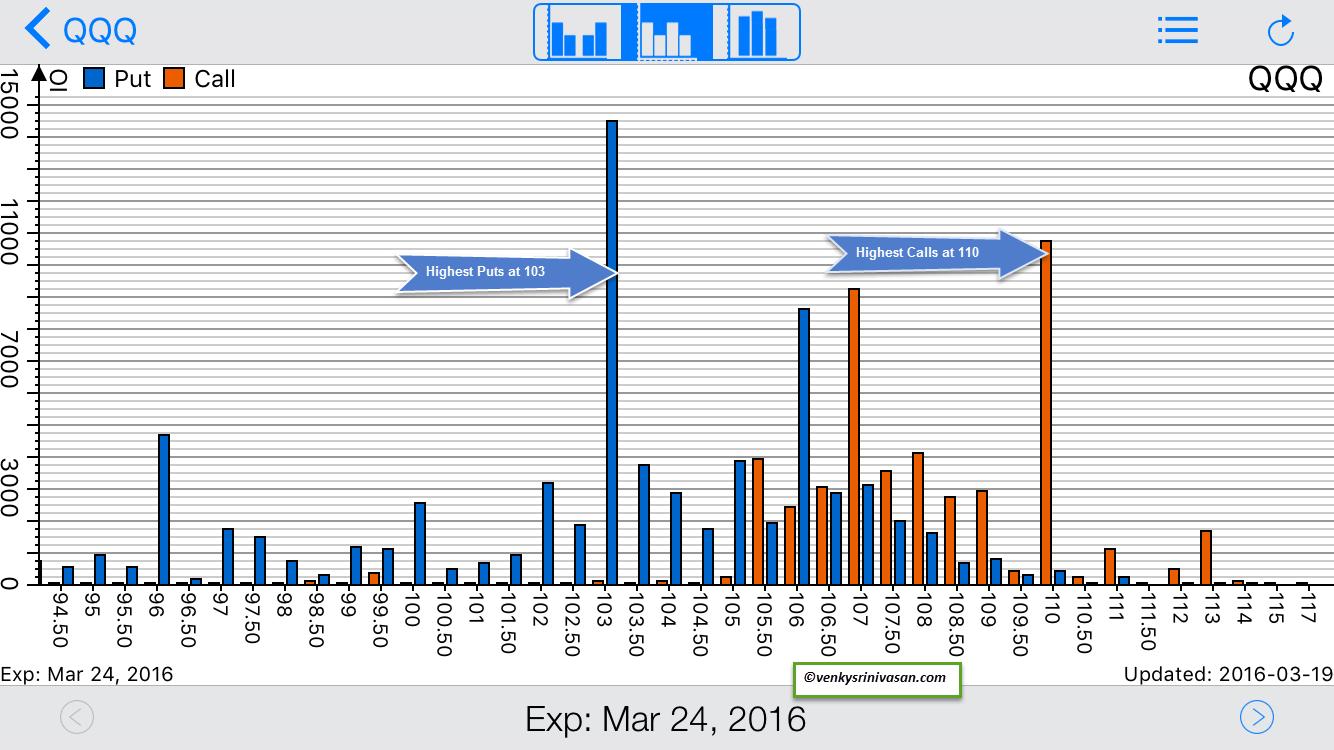
From an Open Interest standpoint, here are the potential scenarios:
Highest Calls: 110
Highest Puts: 106
- If $QQQ moves below 107, 1st support is at 106 then 105 via puts. There is bigger support at 103 where the highest puts are present. However, on the way up and over 106, 107 has a ton of calls and can act as potential resistance this upcoming week if price stalls there.
- If $QQQ does continue higher over 107, then there is some resistance at 108 but over that has resistance only at 110 where the highest calls are. This is a very bullish scenario next week as long as 106 holds and can get over 107 quickly early on in the week.
$IWM – Daily/Weekly and Open Interest:
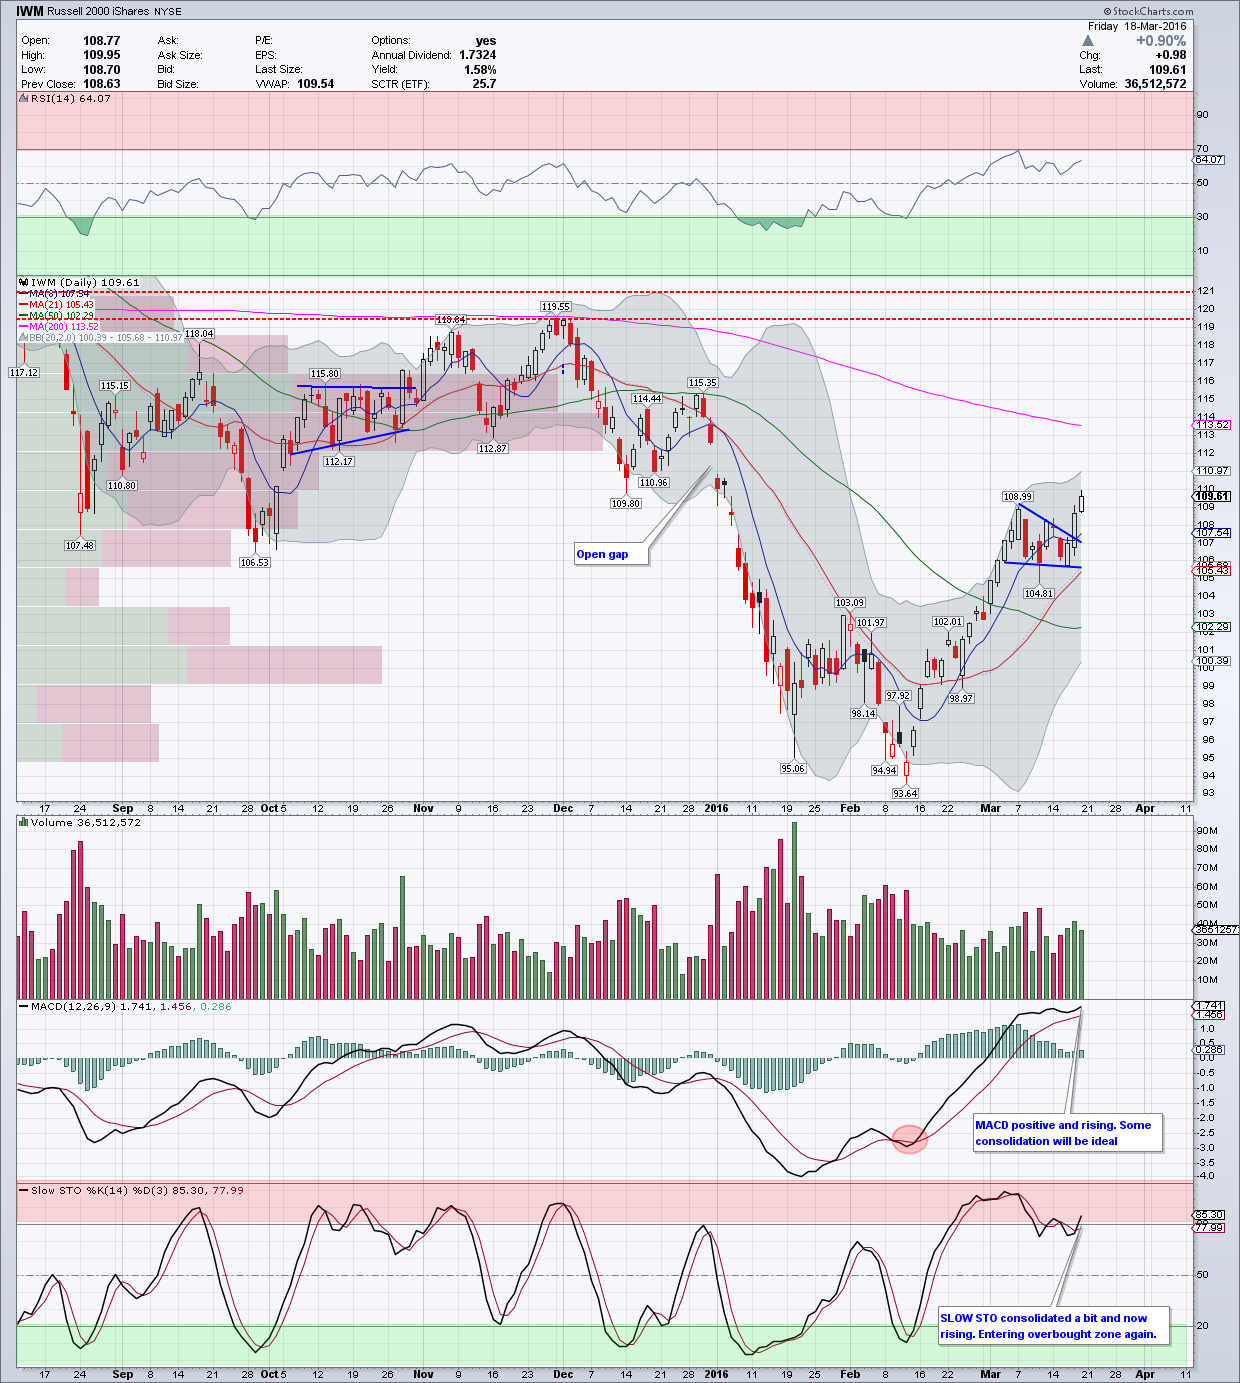
On a Daily timeframe, $IWM began the week by printing a DOJI and confirmed lower on Tuesday with a move lower. All this meant potentially was some consolidation after a huge move from the lows. Price was extended from its 8 SMA and it pulled back towards it and a little lower, only to get many market participants excited on a potential stall without filling the gap. However on Wednesday, it started moving higher and by then it had formed a bull flag. Thursday and Friday, $IWM broke out of the bull flag and continued higher to follow-through.
Very constructive price action here and Bollinger bands have started opening up to support higher prices. Any consolidation or a pullback to retest the 107 breakout zone will be very bullish for $IWM to fill the gap between 112-113 and also test its 200 SMA on this timeframe.
From a momentum indicator standpoint, RSI is firmly rising in the bullish zone while MACD is positive and rising. Some consolidation here may be ideal though. Slow STO, had worked off a little of the overbought conditions but now it is back at or near the overbought zone again with the rising posture. There is some room before next consolidation.
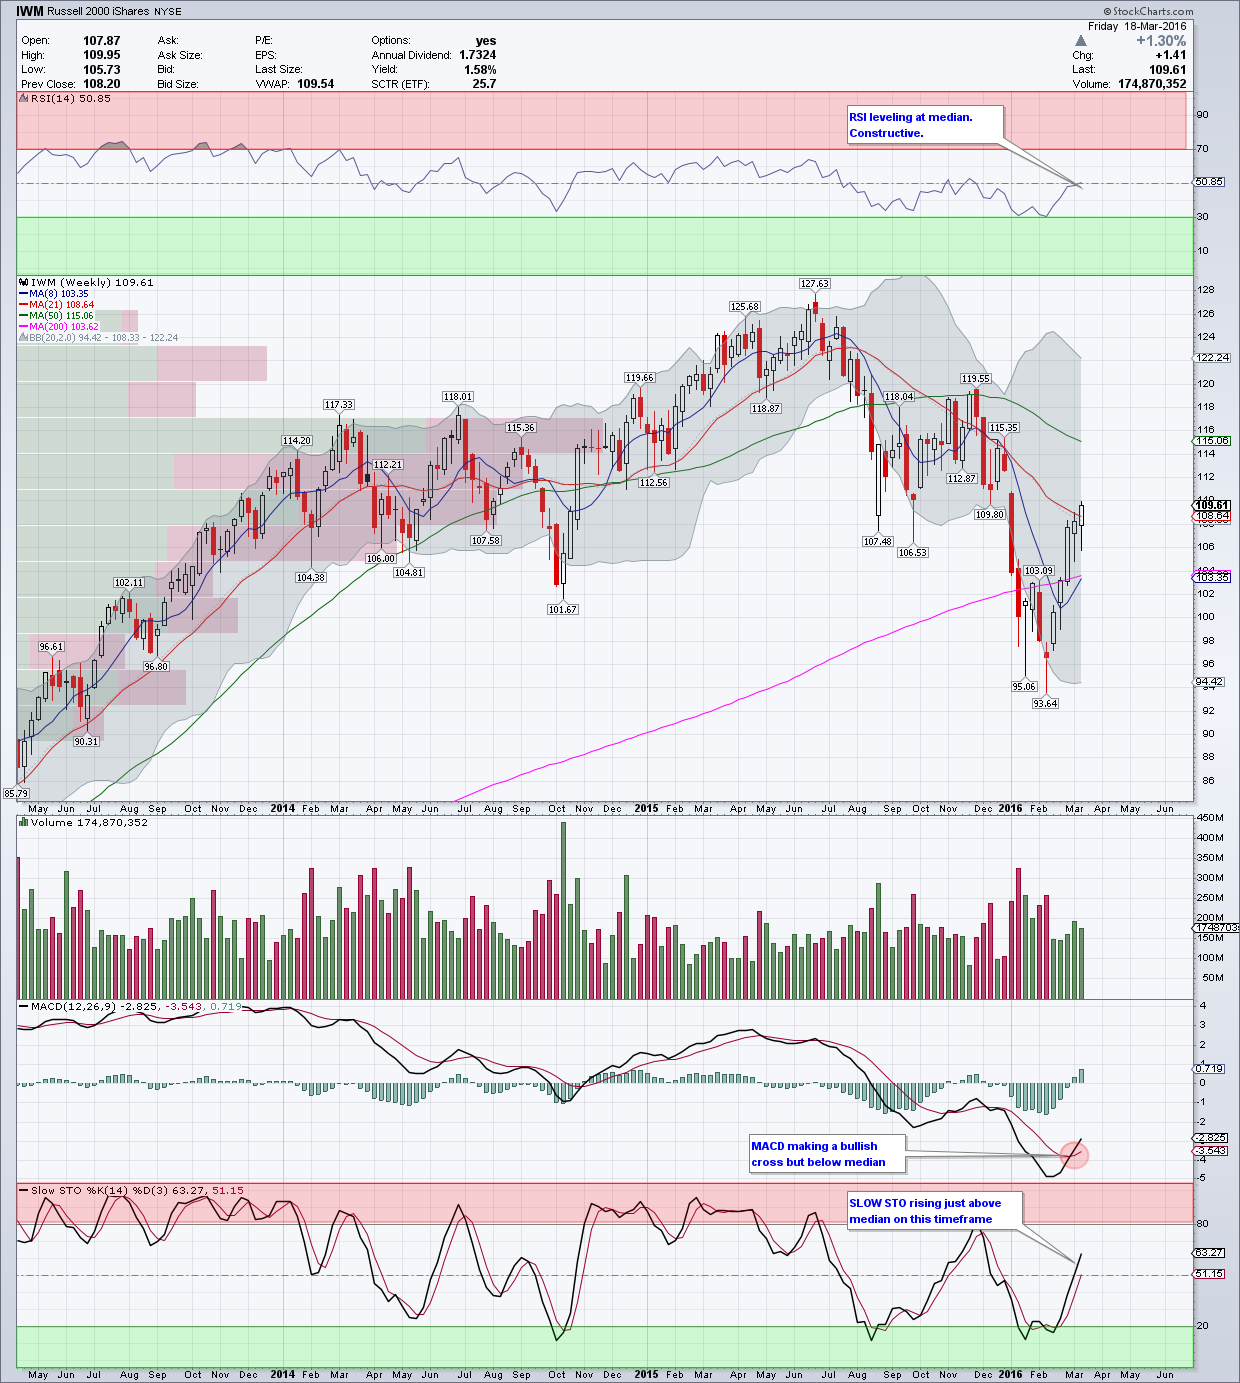
On a Weekly timeframe, $IWM also has printed 5 candles higher after the Hammer and is now over its weekly 200 SMA. Weekly 50 SMA comes in at 115.06 as of now. Very constructive action but some consolidation here will be ideal though. In fact, price is at or near the prior consolidation zone. From a momentum indicator standpoint on weekly timeframe, RSI is rising but barely over its median while MACD on this timeframe has made a bullish cross and is rising. Overall, with some consolidation, expect higher prices for $IWM.
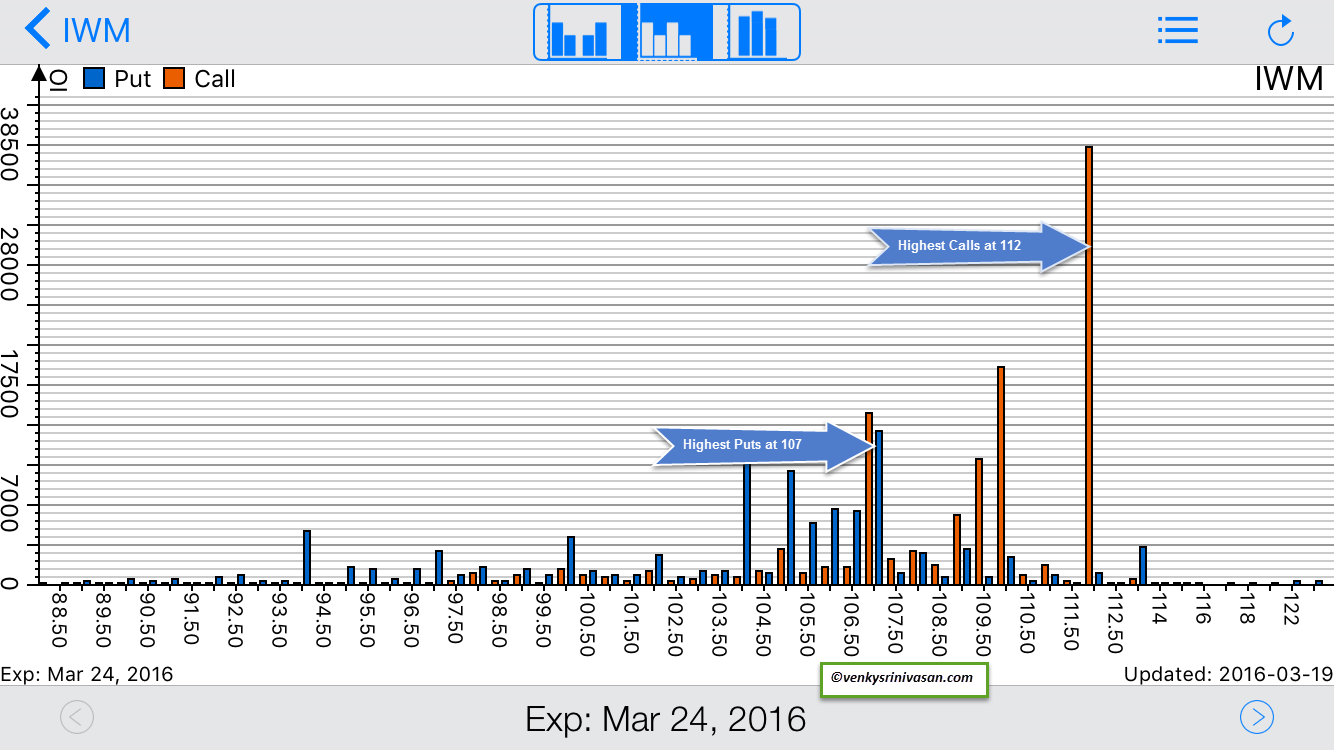
From an Open Interest standpoint, here are the potential scenarios:
Highest Calls: 112
Highest Puts: 107
- If $IWM moves higher and remains over 109, 110 is a potential stall zone to start the week as there are high number of calls which may act as resistance. Any move over it may not be sustainable as there are not many puts to support such a move.
- The ideal scenario for $IWM is to move towards 107 where the highest puts are present and then launch a move higher over 109 towards 110 or 112 where the highest calls are present. This may also help fill the gap above but I am not sure if it will be this week or not. Some consolidation might be ideal before such a move. Additional support is available at 105 and 104 but 107 might act as resistance with the high number of calls at the start of the week.
Wrap-Up:
Price action overall has been constructive and the move from the lows have been pretty fast. So far what we’ve seen is higher lows and higher highs on many charts on intraday basis with some consolidation intraday to work of any overbought condition shorter term. $NYMO is back at 60 which some may indicate as overbought. Some consolidation or a pullback to support zones to provide higher lows will be very constructive. There is no sell signal yet and market participants are trying to sell every move higher and that is acting as a potential catalyst for price to move higher. Wait for price confirmation higher or lower and then act accordingly. Be disciplined and patient and follow price.
Have a blessed trading week ahead.
Twitter: @sssvenky
The author has positions in mentioned and related securities. Any opinions expressed herein are solely those of the author, and do not in any way represent the views or opinions of any other person or entity.


