The March options expiration ended with all three major stock market ETFs ($SPY, $QQQ and $IWM) finishing higher. $SPY closed well over its 200 SMA and is nearing potential resistance levels. While $QQQ also moved higher lethargically, $IWM consolidated well and broke out of a bull flag higher.
$TLT showed some signs of life and is trying to bounce with a potential chance of a break higher. $CL_F (Crude Oil) moved higher while $GC_F (Gold) bounced after moving lower. $DX_F (U.S. Dollar) continues its downward move and took another pounding last week.
Market breadth expansion was the norm with some intraday consolidation. With all that said, there are no sell signals yet to go short.
From a breadth standpoint, here are a few indicators that may provide clues for the upcoming week:
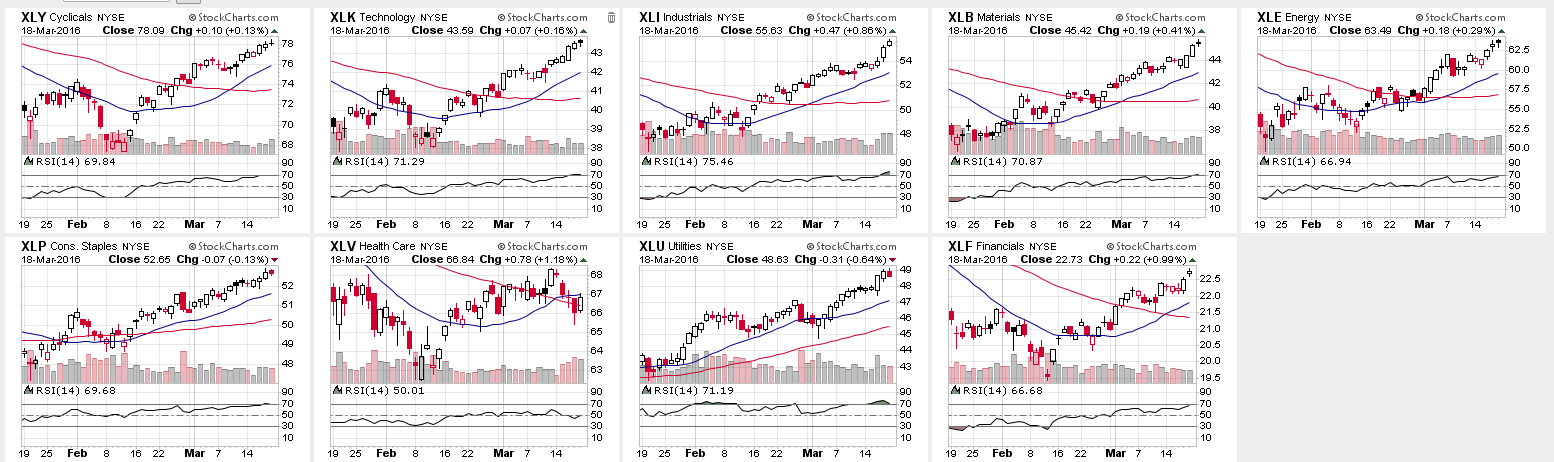
SECTOR PERFORMANCE:
From a sector standpoint, 6 out of 9 stock market sectors are overbought with 2 approaching 70 zone. Some consolidation next week with potential rotation into $XLV and/or $IBB is possible. $XLE and $XLF still have some room before being overbought.
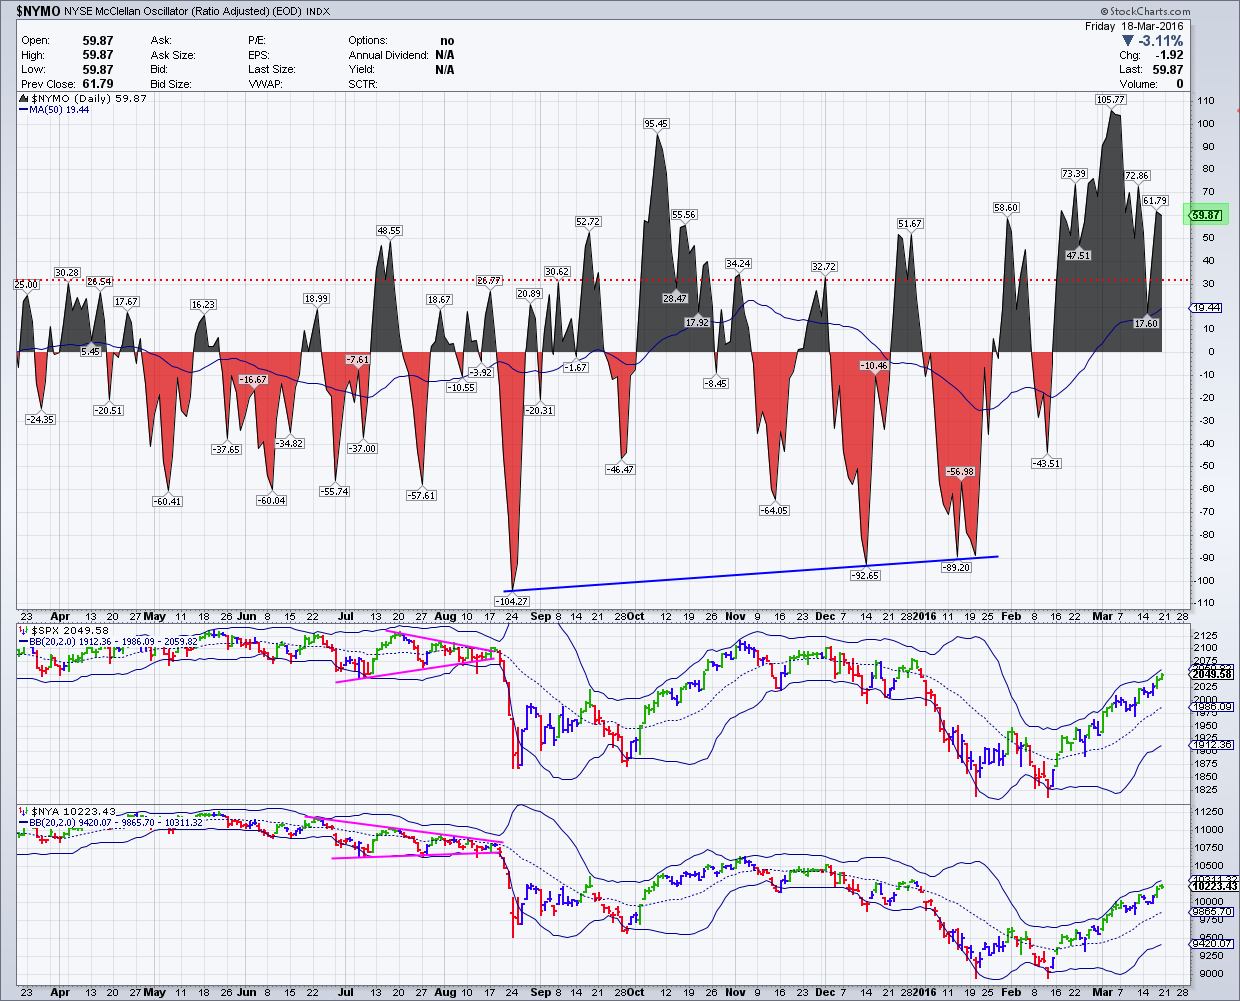
$NYMO (McClellan Oscillator):
$NYMO moved lower, consolidated during the week and now it is back at overbought zone. While it can go higher, consolidation here or a pullback towards zero line will be ideal.
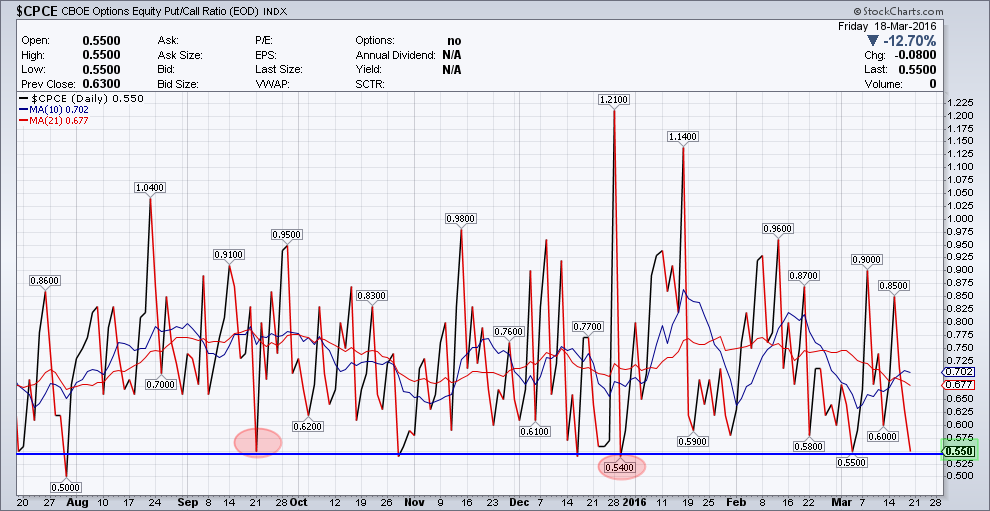
$CPCE (CBOE Options Equity Put/Call Ratio):
$CPCE is now at 0.550, back towards the lower end where bounces have occurred. This means that with stock market indices near or at potential resistance zones, market participants may be rushing to buy protection, inducing some fear near term. This is showing some warning signs plus complacency near term.
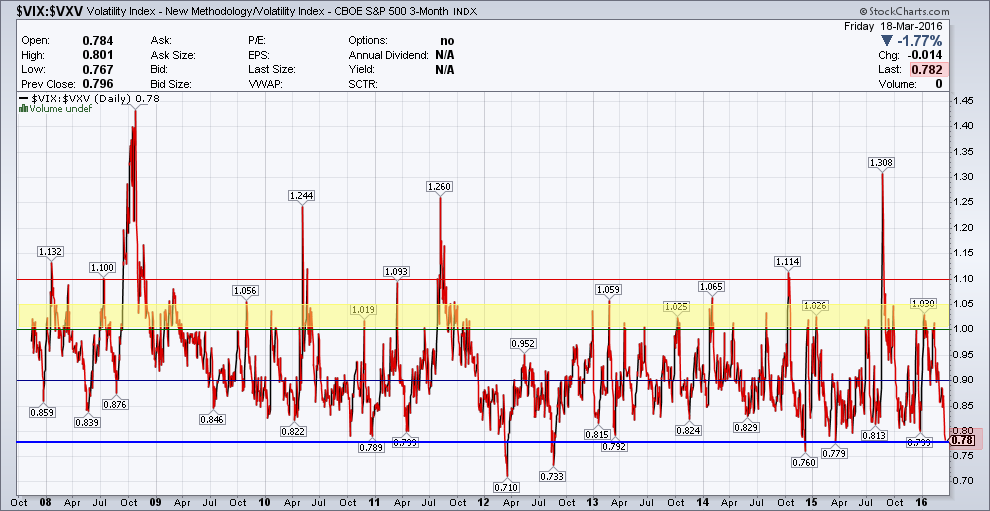
$VIX:$VXV:
$VXV is the 3 month volatility index. The relationship between $VXV and $VIX (30 day volatility) or the ratio between them if > 1.00 often spells trouble for equities. This volatility ratio continues to ease off lower but is at or nearing a point where this can bounce. It finished the week at 0.782. This is also showing some warning signs plus complacency near term. Another one to watch next week if there are short term pullbacks and some bounce in $VIX.
$SPY – Daily/Weekly and Open Interest:
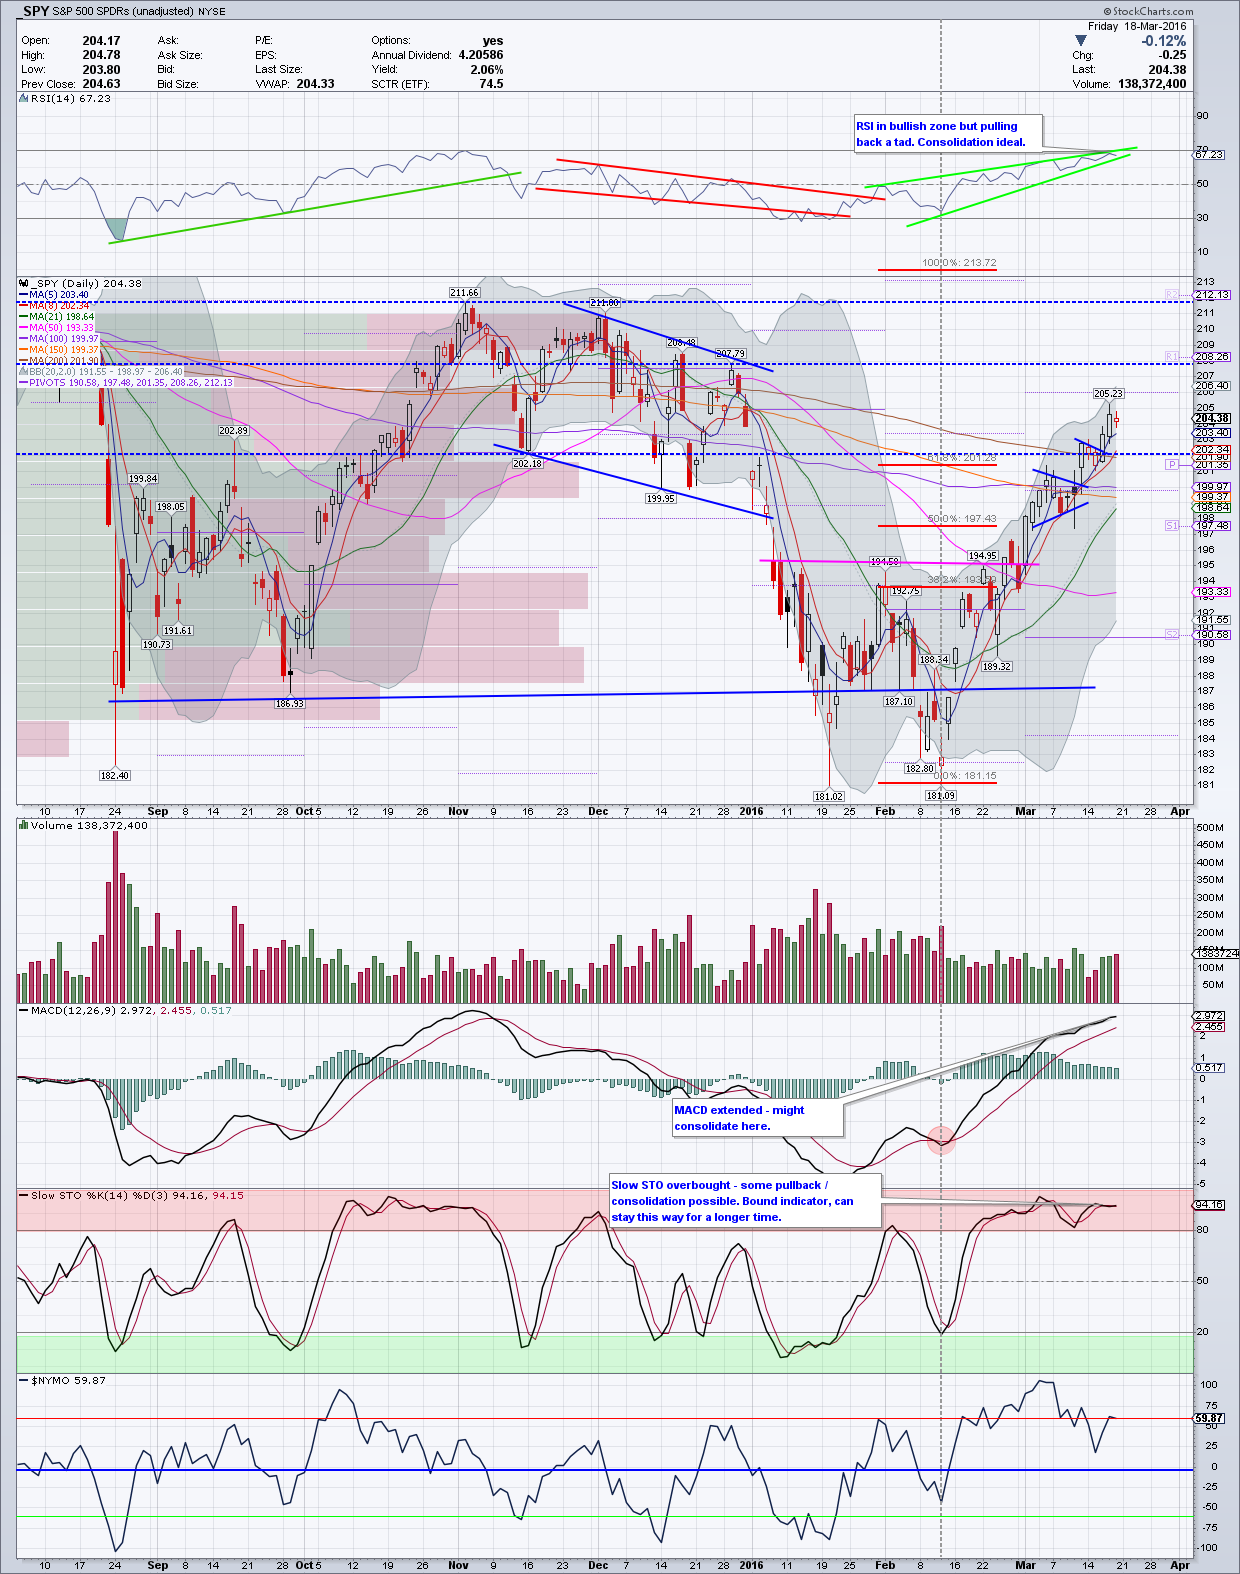
On a Daily timeframe, $SPY began the week above the 200 SMA but started pulling back a bit towards the 200 SMA. The gap from early January was still unfilled. This is a normal reaction to any break higher to retest either the breakout zone or any moving average before higher. On Wednesday, it continued higher didn’t look back for rest of the week, even with $SPY going ex-dividend. On Friday, it printed a DOJI and that means indecision. There is a potential for a pullback or consolidation if the DOJI is confirmed lower at the start of the week.
Price is clearly above all moving averages and moving away from the 200 SMA. 8 SMA and 21 SMA have started to rise nice as well while 50 SMA is trying to flatten out a tad. From a momentum indicator standpoint, RSI is rising but near 70 and hence consolidation here is ideal first before the next move higher. MACD too is rising but getting a tad extended for the shorter timeframe. Here too consolidation is ideal. Slow STO though is embedded and is in the overbought zone. A pullback / consolidation here too may be on cards.
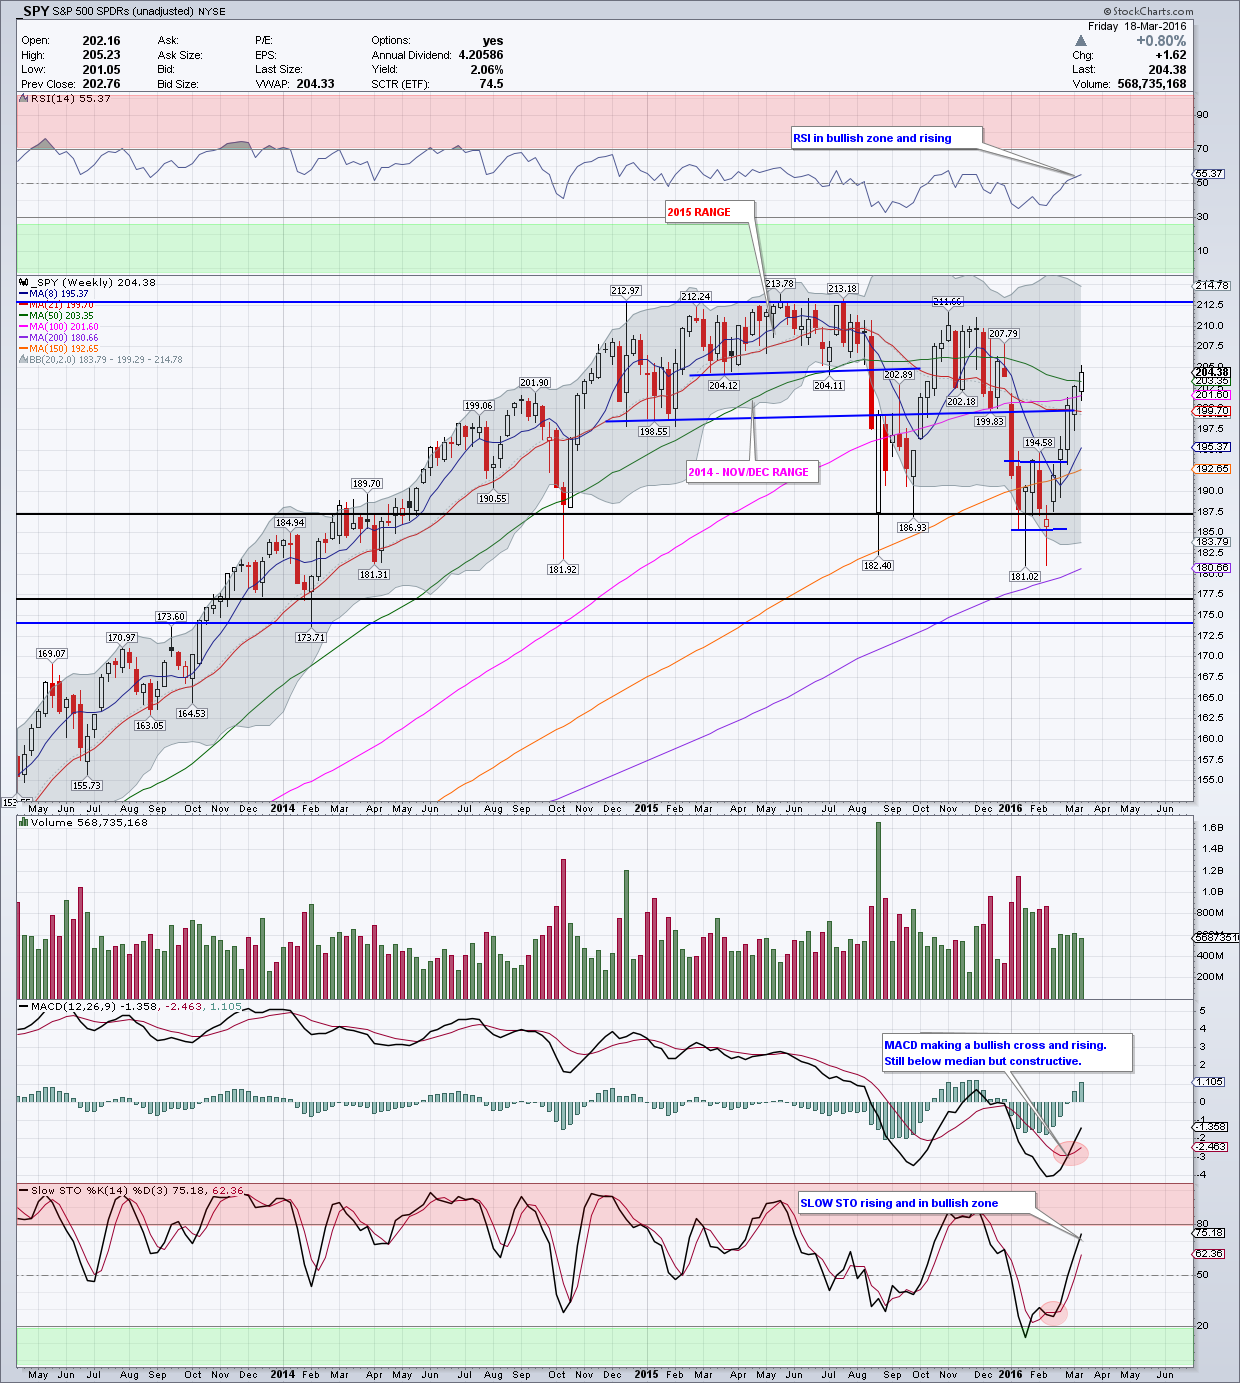
On the Weekly timeframe, $SPY has printed another bullish candle for the 5th successive week. Price on this timeframe is over its declining 50 SMA. The RSI on this timeframe is rising and in the bullish zone while MACD has made a bullish cross and rising too. It is still below median but constructive so far. Overall, with some consolidation, look for higher prices on $SPY towards 208 which happens to be the measured move of this move. (See $SPX chart for measured move).
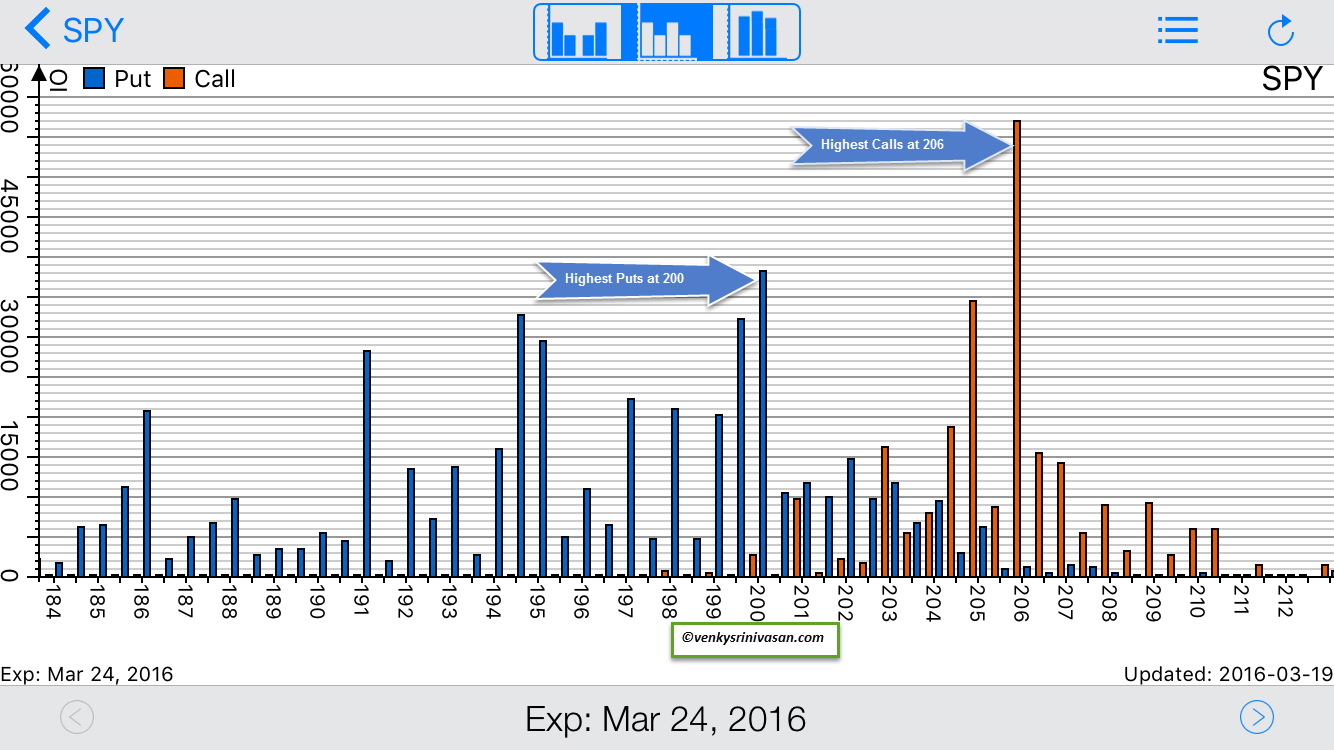
From an Open Interest standpoint, here are the potential scenarios:
Highest Calls: 206
Highest Puts: 200
- If $SPY starts the week lower, below 205, look for the 1st support around 203. If that doesn’t hold the next support zone is 201-200 where there are quite a few puts. Additional support zones are available if 200 is lost at 199, 198, 197, 195 and 194 and these are worst case scenarios.
- If $SPY moves over 205 and towards the 206 price level, with a lot of calls there, look for resistance. A pullback from there towards 203 is possible and scenarios outlined above hold good. But if 203 does hold and $SPY does move over 205 and 206, there is always a chance for it to move towards 207 and/or 208. I will not rule this higher move out yet with the bullish posture of the momentum indicators and price.
Note: Since these are weekly options, there can be quick changes to them during the course of the week. Pay attention to those changes as the above mentioned scenarios can change a bit depending on where the change is.
continue reading on the next page…

: Showing Some Signs of Emerging Strength")
