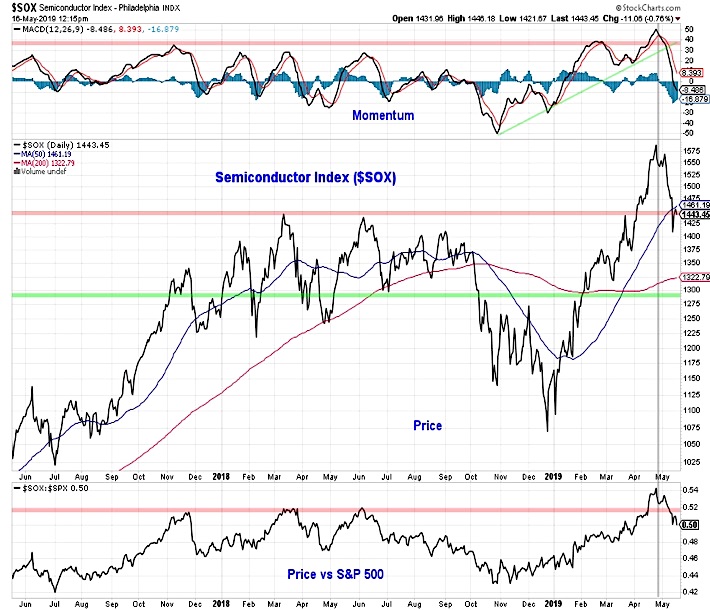
The semiconductor index tends to have two important traits that merit a specific focus right now. The index tends to be sensitive to global economic trends and it has been serving as a leading index for the S&P 500. On a relative basis, semiconductor peaked and bottom prior to the S&P 500 in 2018. Given this, the recent weakness in Semiconductors (on both an absolute and relative basis) bears watching.
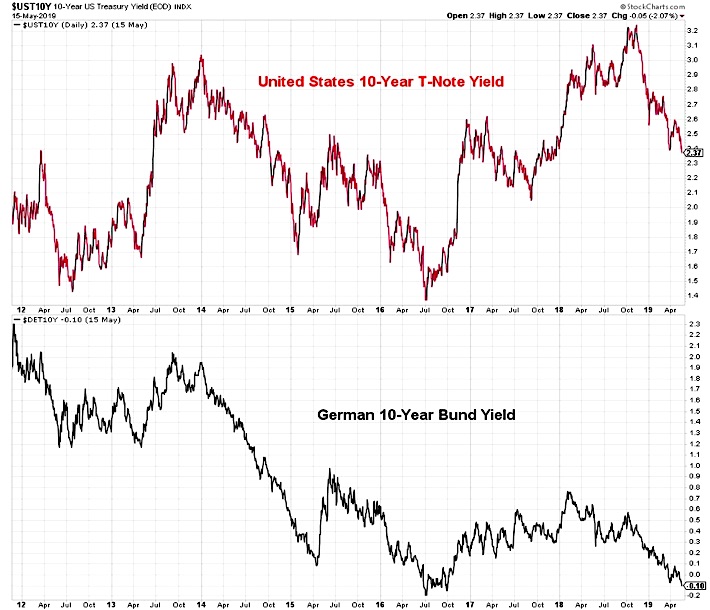
Concern about the global economy is also being expressed in the bond market. The yield on the U.S. 10-year T-Note has dropped to its lowest level since late 2017. The yield on the German 10-year Bund is back into negative territory and at its lowest level since mid-2016. Accompanying declining bond yields has been a rise in expectations that the next move by the Fed will be to cut interest rates. Fed funds futures see nearly a 75% chance of at least one interest rate cut by the end of 2019.
This contrasts with the published dot plot by the Fed which communicates patience on the part of the Fed, but also likelihood that that next move is likely to be a hike, not a cut. The caveat to the dot plot information is that it has not been updated since March. The economic projections that will be released in the wake of the June FOMC meeting will likely be received with higher-than-normal levels of curiosity.
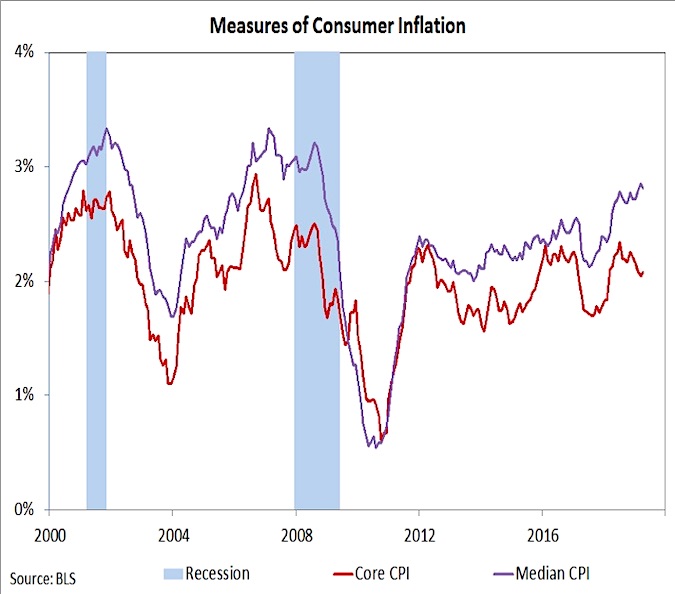
Recent Fed speakers have pushed back against the market’s view that the next move will be to cut rates in the relatively near term. Most of the argument for lower rates has centered on the drop in core inflation (though increased concerns about the outlook for growth could change that).
At his most recent press conference, Fed Chair Powell pushed back (rightly in our view) against the view that the recent drop in core inflation suggests inflation pressures are easing. Alternative measures of inflation (developed in an academic setting, unlike the so-called core inflation measures which were developed for the sake of political expediency) show a more robust trend in inflation. Expectations for a rate cut are likely higher than warranted and if growth concerns ebb, these expectations could as well (and bond yields could move higher as a result).
The day-to-day noise can sometimes drown out important longer-term developments. Not only is the current economic expansion approaching its 10thanniversary and closing in on being the longest on record, but there is reason to hope that the uptick in growth seen in recent years is the beginning of a sustainable trend higher. Yearly productivity growth has surged to its highest level in nearly a decade and the underlying trend in productivity has turned decisively higher after a decade and a half of decline. This does not preclude near-term slowdowns in growth, but it does suggest that a new growth regime is emerging.
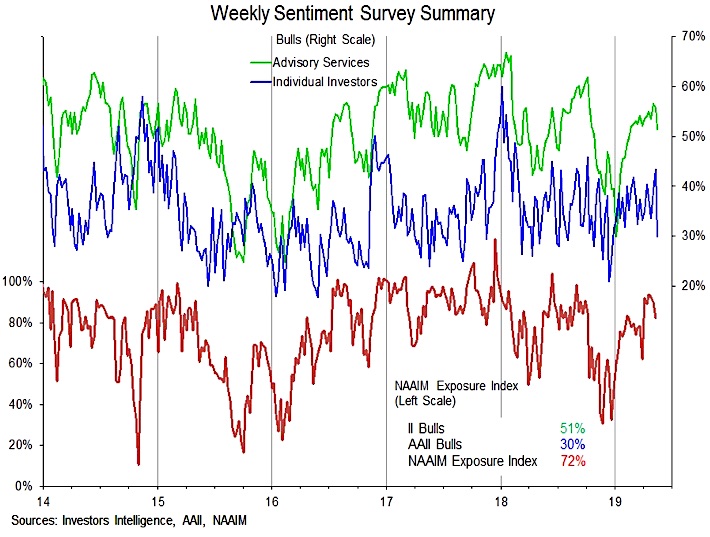
To provide evidence that the stock market may have overreacted to near-term trade and growth concerns, we are watching investor sentiment. The uptick in volatility in May has taken some of the edge off of investor optimism that has soared in tandem with stocks over the first four quarters of 2019. Continuing to work off this optimism as we moved into the summer months could have favorable implications for the overall weight of the evidence (if market volatility and macro concerns fuel a meaningful uptick in pessimism. While there has been some evidence of pessimism in very short-term oriented measures of sentiment, these weekly surveys suggest the move away from elevated optimism is only beginning.
In tandem with the sentiment data, we are also keeping a close eye on indicators of broad market health. The S&P 500 moved to a new all-time high in April, but got little by way of confirmation from other indexes. The NASDAQ composite made a new high even though half of the stocks in the index were not even trading above their 200-day averages. The Dow industrials did not make a new high in April, and the small-cap Russell 2000 remains nearly 10% below its mid-2018 peak.
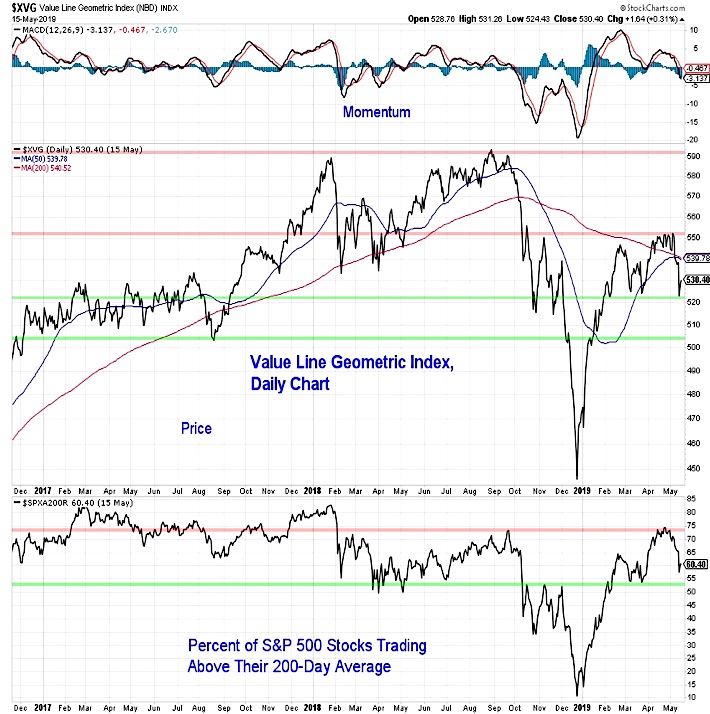
The Value Line Geometric Index (which gauges the performance of the median stock) has stalled since rallying in January and February and in May came close to undercutting its March low. Likewise, while the S&P 500 itself made a new high, the percentage of stocks in the index trading above their 200-day averages has struggled to eclipse the levels seen in February and September 2018. Upside breakouts in these breadth indicators could support a more constructive view in the second half of the year, but for now they remain in consolidation mode.
Twitter: @WillieDelwiche
Any opinions expressed herein are solely those of the author, and do not in any way represent the views or opinions of any other person or entity.


