Stocks sold off on Friday as investors continued to process news about the coronavirus, U.S. politics, and a slate of corporate earnings.
While there may be catalysts for corrections, the best way to gauge stock market selloffs is by the price action and price / sentiment indicators.
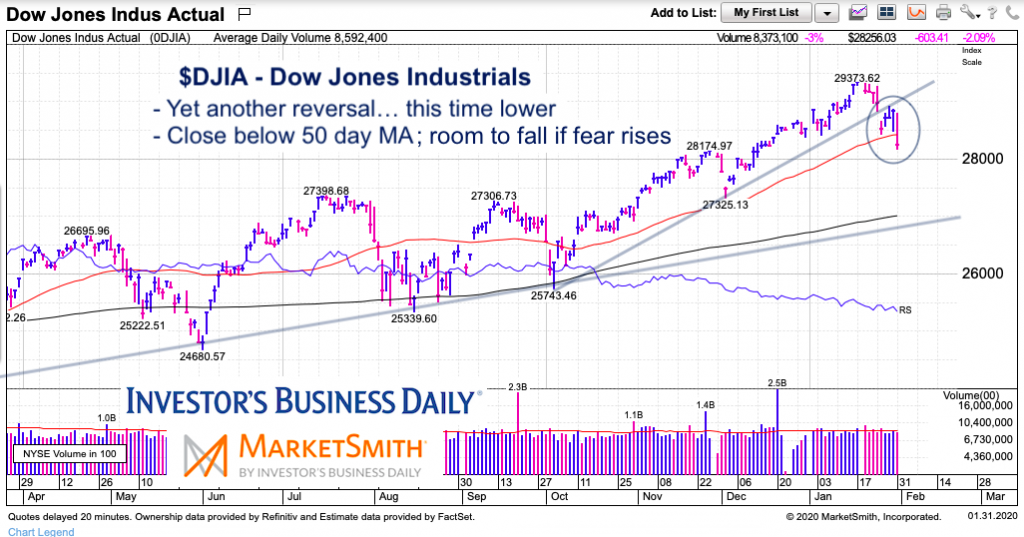
In this post, I’ll simply share a chart of the U.S. stock market (the Dow Jones Industrial Average) as of Friday’s close. I’ll add some insights about the chart and 3 things I’m watching on this pullback.
Very broadly, those three things are price trends, volatility, and capitulation / fear.
Note that the following MarketSmith charts are built with Investors Business Daily’s product suite.
I am an Investors Business Daily (IBD) partner and promote the use of their products. The entire platform offers a good mix of technical and fundamental data and education.
Dow Jones Industrial Average “daily” Chart
In monitoring this pullback, there are 3 things I’m watching (across the major stock indices).
1. Price Trend: Currently, the Dow Industrial Average is trading below its short-term up-trend line. This was broken on Monday and signaled that the pullback should be respected. Price then fell below Monday’s lows while declining through its 50 day moving average (another trend gauge). This is a clear sign of caution. Note that I also follow Fibonacci retracement price levels.
2. Volatility: We’ve seen price rock back and forth on several days, with similar turbulent action on the VIX Volatility Index. Another sign of caution.
3. Rising volume and fear / capitulation: We saw hints of fear today but it will take a stronger move lower to truly feel that “out of control” panic selling. If the selloff continues, investors will want to see the VIX rise over 20 before looking for a bottom. Next support levels are the intermediate-term trend line and 200 day moving average.
Twitter: @andrewnyquist
The author may have a position in mentioned securities at the time of publication. Any opinions expressed herein are solely those of the author, and do not in any way represent the views or opinions of any other person or entity.


: Showing Some Signs of Emerging Strength")
