Meanwhile, as the Federal Reserve relented from its pickle and a rock fears, it intimated that it would finally raise rates in December, the Indomitable Dollar continued to wreck oil, stocks, bonds, and foreign stocks, to the point where no asset classes in my models were investable. Another sign that the stock market was in a transition to price discovery mode.
The Federal Reserve did relent and raise interest rates in December but did so while keeping the balance sheet stable, a kid-gloves QE-Tight approach. The move of holding the balance sheet steady weighing on the long end of the yield curve could threaten recession by flattening the yield curve. Markets sensed the Fed is on a Ledge.
U.S. equity markets did not mount a “Santa Clause Rally” to end the year, but did “pull a 2011” (violently unchanged) due to a mounting Christmas List of not so good things under the chart tree.
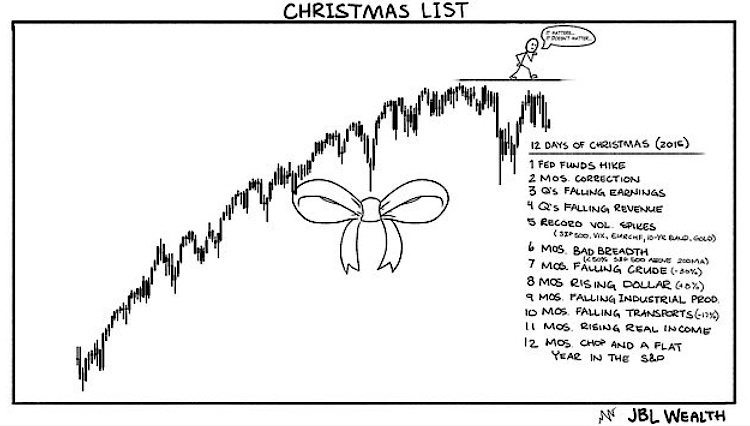
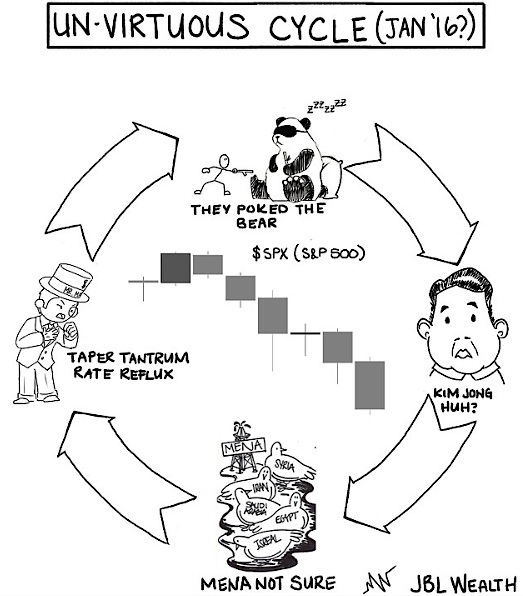
The stock market now looks poised to make a lower low 4 months after its initial 10% decline, the Federal Reserve is in a distorted tightening cycle, Transports, Industrials, Small Caps, and Biotech among others are in bear market territory (down 20%+ from highs) as are over 50% of S&P 500 stocks, and crude is probing levels not seen since late 2003 and jerking the markets down with it. An Un-Virtuous Cycle of China economic data and currency machinations, uncertainty in volatile regions – perfect storm for oil – and wildly irresponsible Federal Reserve speeches are weighing heavily of investor sentiment. Stock market price discovery is here.
So, where does this leave us for 2016? Let’s look at the updated Building Monuments II from October. The right shoulder of the “monument” is now complete (a Last Hurrah?) as the S&P closed at 1880 Friday, January 15th – right at the kneckline of the 1 1/2 year head & shoulders pattern. Now, market pundits on CNBC are saying 1620 is a downside target (where the mummy is is buried from my October post). It may be playing out as I outlined in October… we will see.
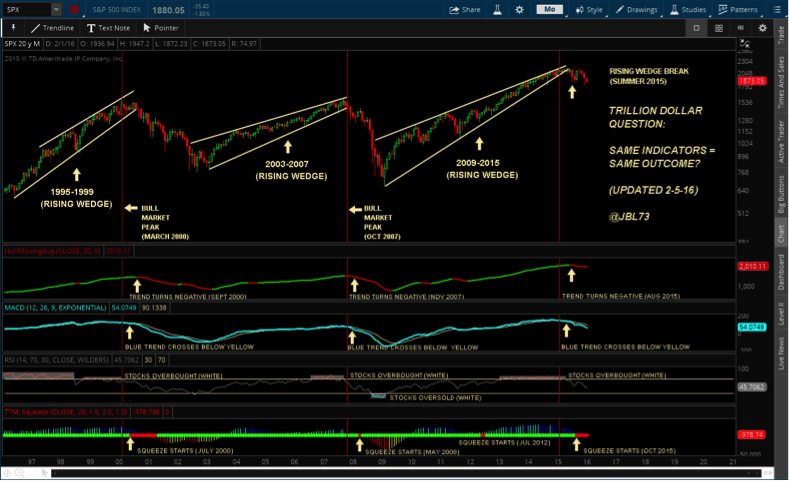
Now let’s take an updated look at The Trillion Dollar Question (first posted in April 2015): The stock market indicators were prescient, as the Multi-Year Rising Wedge Broke in Summer 2015 + the Blue Trend Has Continued Below Yellow Trend for 12 Months + the Market Leaving Overbought in May 2015 was Bearish. The S&P 500 has declined 10%+ below the May 21st, 2015 highs three times, most recently Friday of last week. Again, this seems to be playing out as well.
In my opinion, we are not in 2008-type crisis, we are in correction and possibly a bear market with healthy stock market price discovery, a possible fall to old 2000 & 2007 highs (that 1600 level), with better days ahead without the artificial stimulus of the Fed. I welcome it as we have been very conservatively positioned since early Summer.
Either way, should we correct down to old highs, or if this is all over this week and the market has a banner year, we put our emotions aside and let Trend guide.
Disclaimer from the author:
JBL WEALTH ADVISORY IS A REGISTERED INVESTMENT ADVISER. INFORMATION PRESENTED IS FOR EDUCATONAL PURPOSES ONLY AND DOES NOT INTEND TO MAKE AN OFFER OR SOLICITATION FOR THE SALE OR PURCHASE OF ANY SPECIFIC SECURITIES, INVESTMENTS, OR INVESTMENT STRATEGIES. INVESTMENTS INVOLVE RISK AND UNLESS OTHERWISE STATED, ARE NOT GUARANTEED. BE SURE TO FIRSTCONSULT WITH A QUALIFIED FINANCIAL ADVISER AND/OR TAX PROFESSIONAL BEFORE IMPLEMENTING ANY STRATEGY DISCUSSED HEREIN. OPTIONS STRATEGIES ENTAIL DIFFERENT FORMS OF RISK. COVERED CALL WRITING MAY LIMIT THE UPSIDE POTENTIAL OF OUTRIGHT OWNERSHIP OF A SECURITY IN A GENERALLY RISING MARKET. SELLING PUTS COULD REQUIRE AN INVESTOR TO PURCHASE A STOCK AT A MUCH HIGHER PRICE THAN THE PREVAILING PRICE OF THE STOCK IN A MARKET SELLOFF. EXAMPLES PRESENTED ASSUME THE ABILITY TO CONSISTENTLY SELL OPTIONS AT A SPECIFIC PREMIUM AND MAINTAIN OWNERSHIP OF THE STOCK IN A COVERED CALL SCENARIO OR NOT HAVE TO PURCHASE STOCK IN A CASH SECURED SELL PUT SCENARIO. ALL RETURNS ARE NET OF MANAGEMENT FEES.
Past performance of Trend and Momentum models does not predict future performance. All returns shown are with dividends and distributions reinvested. Any benchmark chosen may or may not reflect the same markets or volatility of the back tested portfolio designed and may just be a representative benchmark of a large capitalized stock index. Index returns include dividend reinvestment. Graphs in and of themselves are not predictors of future price movements. All returns shown are net returns and reflect the deduction of the management fees of JBL Wealth Advisory. Back tested modeling has inherent limitations as models do not represent the results of actual trading using client assets but results are achieved by the use of a retroactive application of a back tested model that was designed with the benefit of hindsight. The results do not represent the returns that any investor achieved. Back testing allows the security selection methodology to be adjusted until past returns are maximized. Actual client performance may differ significantly from back tested performance.
Twitter: @JBL73
Any opinions expressed herein are solely those of the author, and do not in any way represent the views or opinions of any other person or entity.


