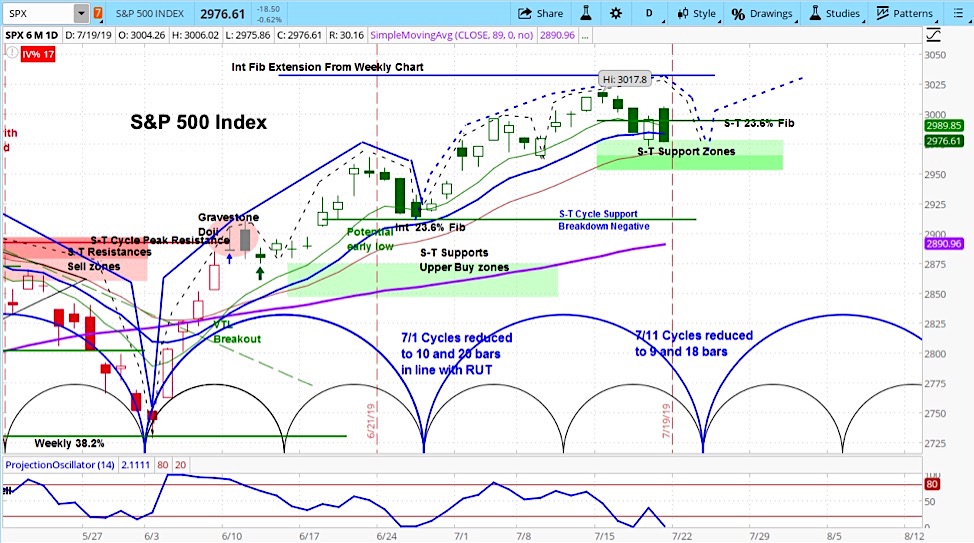
S&P 500 Index (INDEXSP: .INX) Daily Chart
The S&P 500 Index sank 37 points last week to 2976, a decline of 1.2%.
Our approach to technical analysis uses market cycles to project price action. Based on market cycles, our projection is for weakness early this week and then stronger performance towards the end.
Our analysis of the S&P 500 is for initial weakness and then a move higher as we transition into the rising phase of the next cycle.
The S&P 500 is now in a short term support zone of 2953-2986. Early this week we expect downside risk of about 25 points, with an outside chance of greater weakness.
Stock Market Weekly Video – for the week of July 22
The stock market corrected last week as investors were less than enamoured by initial earnings results, as I pointed out in the latest Market Week show.
While 79% of those S&P 500 companies that have reported earnings beat analyst expectations. Yet most achieved this only after having guided expectations lower.
While it’s still early in the season, blended earnings growth actually equates to a decline of 1.9%, according to FactSet.
For more from Slim, or to learn about cycle analysis, check out the askSlim Market Week show every Friday on our YouTube channel.
Twitter: @askslim
Any opinions expressed herein are solely those of the author, and do not in any way represent the views or opinions of any other person or entity.
: All Energy Hands on Deck!")


: All Energy Hands on Deck!")