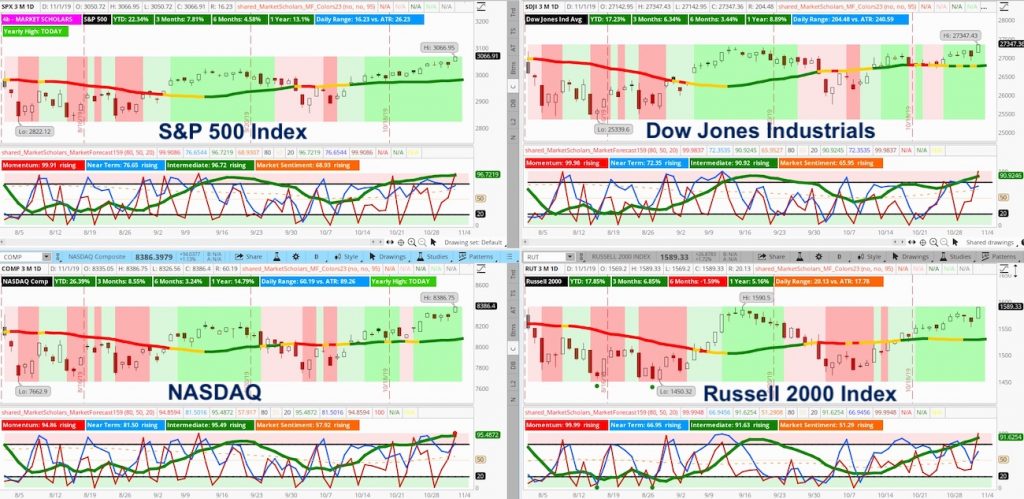
This week, the S&P 500 Index INDEXSP: .INX shows a strong bullish intermediate posture (green line above 80 on Market Forecast) and rising Market Sentiment (orange line above 50) on all major U.S. indexes with the underperforming Russell 2000 Index INDEXRUSSELL: RUT catching up this week.
But, short-term sentiment is showing a red flag. The momentum line spiked to extreme highs on the 17th day of a near-term run.
Coming off the previous near-term low, the S&P 500 has gained 6% in 19 trading sessions. That’s an annualized return of 87.75%. This pattern suggests short-term volatility may emerge soon next week. See video further below for deeper insights.
Despite the expectations for a brief, bearish near-term pullback (potentially down to 3,025), the S&P 500’s weekly and monthly Market Forecast charts are showing strong bullish intermediate patterns.
This week’s Heikin Ashi weekly candle showed a strong bullish breakout signal closing above the highs of the past 14 weeks, which includes 2 intermediate pullbacks.
The Russell 2000 is still lacking the breakout signal but may get its confirming breakout this upcoming week. The small-cap index is strongly correlated with the big tech names in the S&P 500 (FB, AAPL, AMZN, MSFT and GOOGL). They too haven’t broke out of their sideways range yet. This divergence shows the potential left for this intermediate run.
Get market insights, stock trading ideas, and educational instruction over at the Market Scholars website.
The 8- and 17-day EMAs are climbing above a rising 30-day SMA. Also, the MACD’s 9-day SMA (orange line) is climbing to strong bullish levels.
The S&P 500’s four-week range has stretched out to >5% range. This may limit upside potential until the 4-week low starts moving significantly higher by the end of the next week.
Another positive sign that suggests today may have been a breakaway gap, today’s volume and trading range were above-average.
Volatility closed below extreme lows for the first time since September 2018. There’s a good chance $VIX fills out its monthly range with a move towards 15.
Summary: The posture remains strongly bullish. The Russell 2000 has joined the S&P 500 with the strong bullish pattern. But, there’s also signs that risk appetite still hasn’t broken out broadly. This opens up a lot of potential for stock gains into year end. But, in the short-term, there are strong overbought signals that suggest we may get a near-term pullback sooner rather than later.
Stock Market Video – for week of November 4, 2019
Twitter: @davidsettle42 and @Market_Scholars
Any opinions expressed herein are solely those of the author, and do not in any way represent the views or opinions of any other person or entity.

: Showing Some Signs of Emerging Strength")
