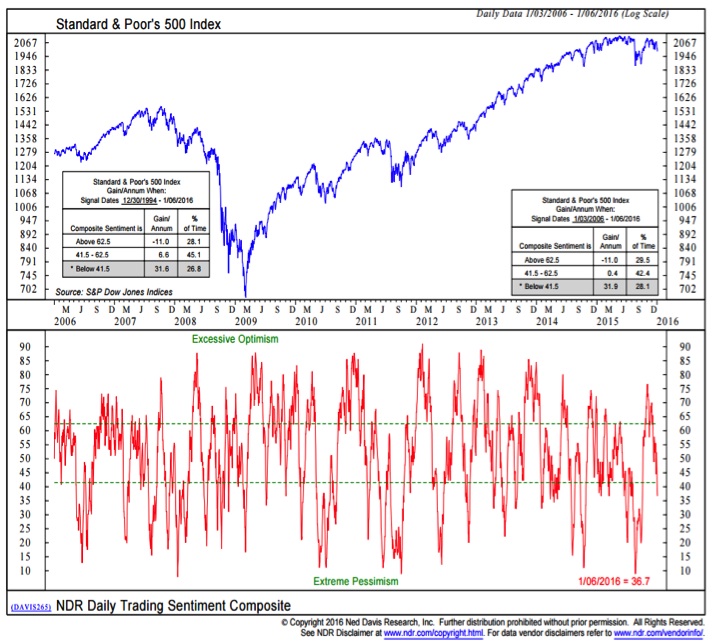
Even more encouraging from a sentiment perspective has been the improvement in the NDR Trading Sentiment Composite. This indicator peaked (at its highest level since mid-2014) in early November, but it has taken until this week to move into the Excessive Pessimism zone. The longer-term NDR Crowd Sentiment Poll also shows excessive pessimism. Excessive pessimism has emerged at a time when investors are usually their most giddy.
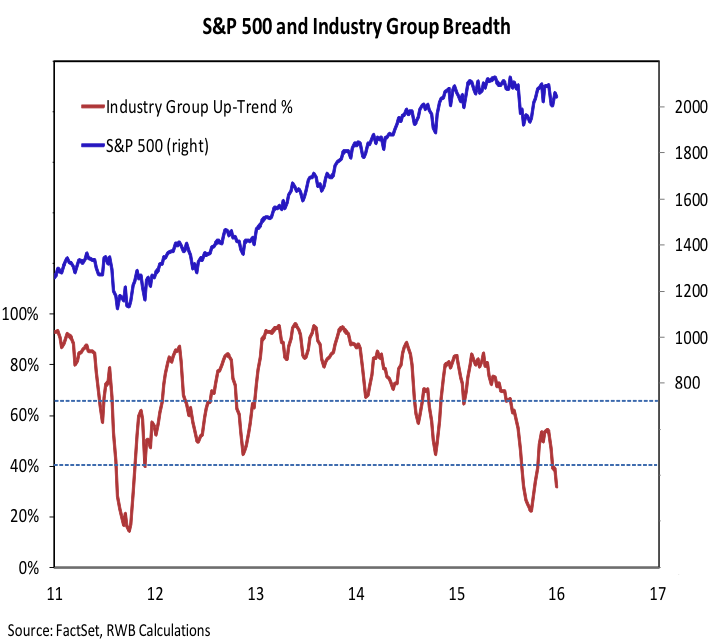
Offsetting the better investor sentiment readings has been a further deterioration in the broad market, which has weighed on the near-term stock market outlook. After an initial surge off of the early Q4 low, the percentage of industry groups in up-trends stalled in the neutral zone. Late-2015 weakness pushed it back below the 40% threshold and given the broad selling seen this week, could soon be back near its low. The failure to see any follow-through to the upside and now renewed weakness in this indicator suggests that overall market breadth has turned bearish.
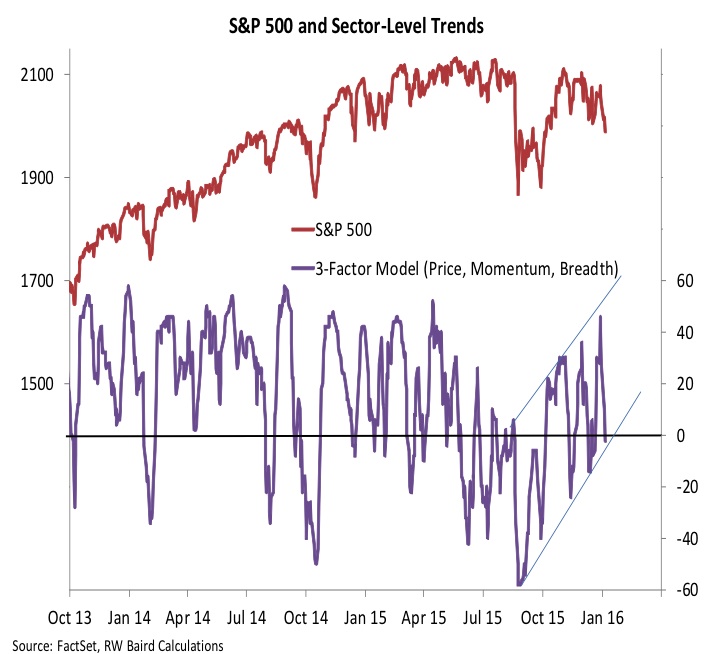
One bright spot from a breadth perspective has been our sector-level trend indicator. This looks at short-term price, breadth and momentum trends across the 10 S&P sectors, and it has been making a series of higher highs and higher lows since bottoming in September. While it is encouraging, it is not enough to offset the host of other market breadth indicators that argue for a more cautious approach and have weighed on the near-term stock market outlook.
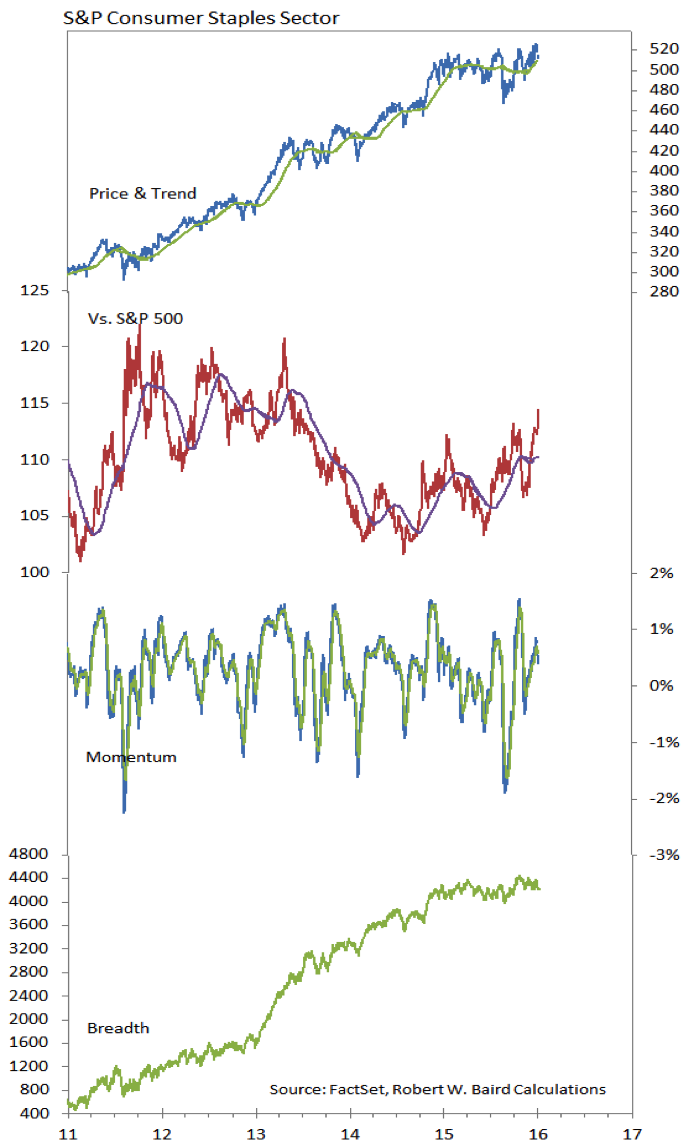
From a seasonal perspective, not only were small-caps expected to be strong (they have not been) but Consumer Staples was expected to be weak (it has not been). Consumer Staples has seen a resurgence in relative strength, in both our sector rankings (it moved to the top spot this past week) and on a relative price basis (versus the S&P 500, Staples is at its highest level since early 2013). Market breadth has been relatively stable and the absolute price trends have been resilient.
Thanks for reading.
Twitter: @WillieDelwiche
Any opinions expressed herein are solely those of the author, and do not in any way represent the views or opinions of any other person or entity.


