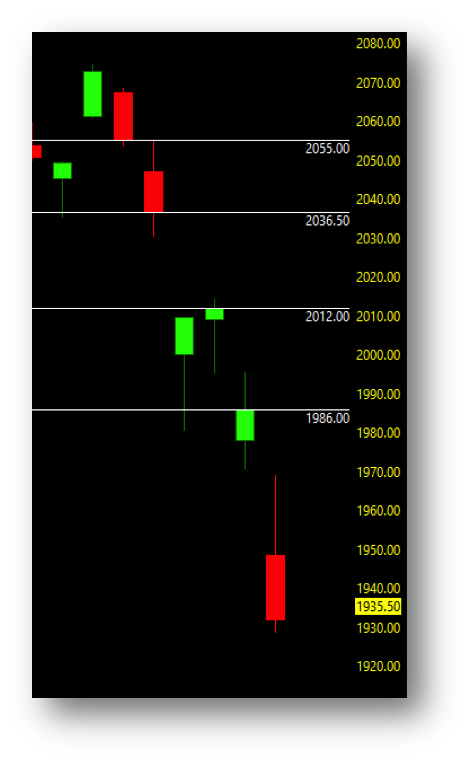
ES Open Gaps to the Upside.
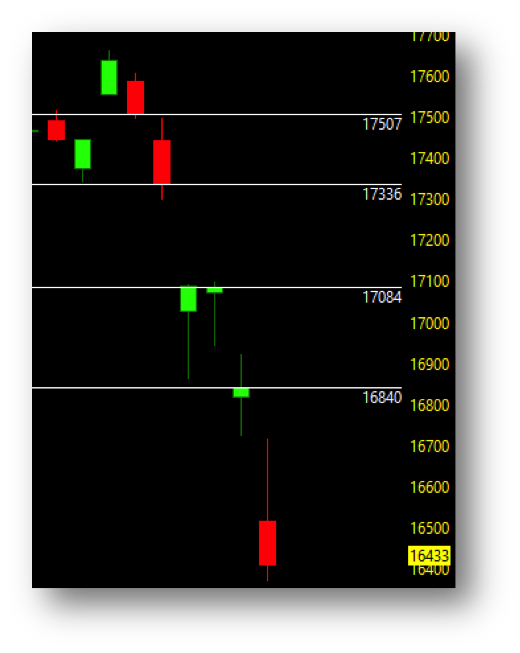
YM Open Gaps to the Upside.
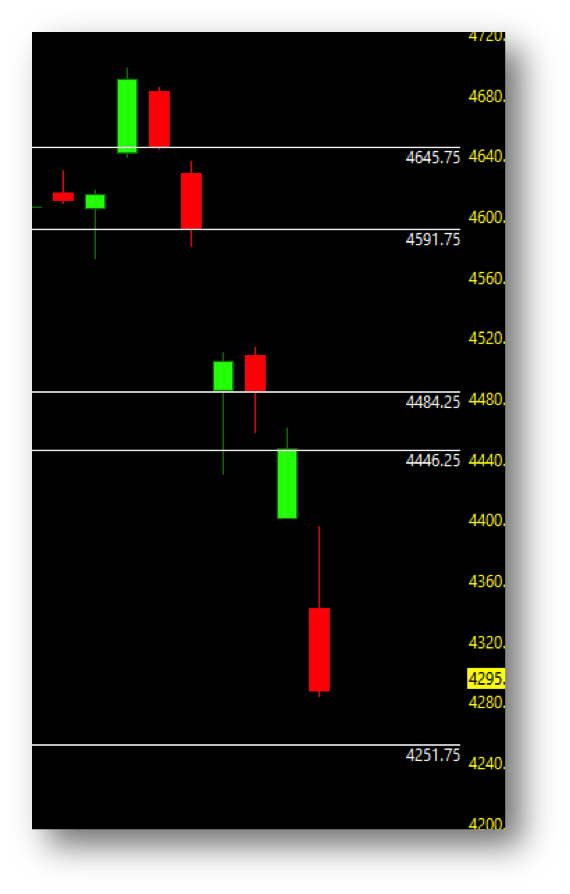
NQ Open Gaps to the Upside.
TF Open Gaps to the Upside.
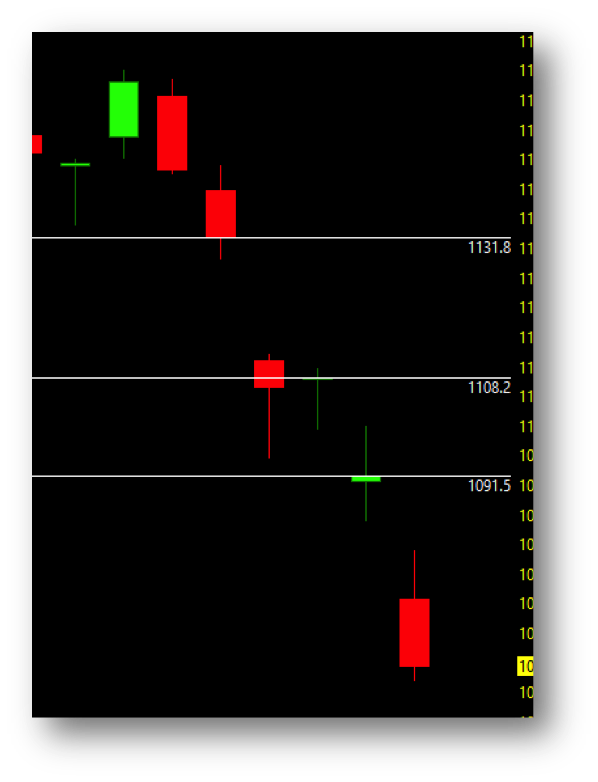
What is the likelihood and at which point may these upside open gaps be closed?
Operating on the same premise that I began back in November 2015 and with open gaps now to the upside, I will focus on the swing position charts which initially positioned price action to the short, will now turn to the long side on a moving average crossover.
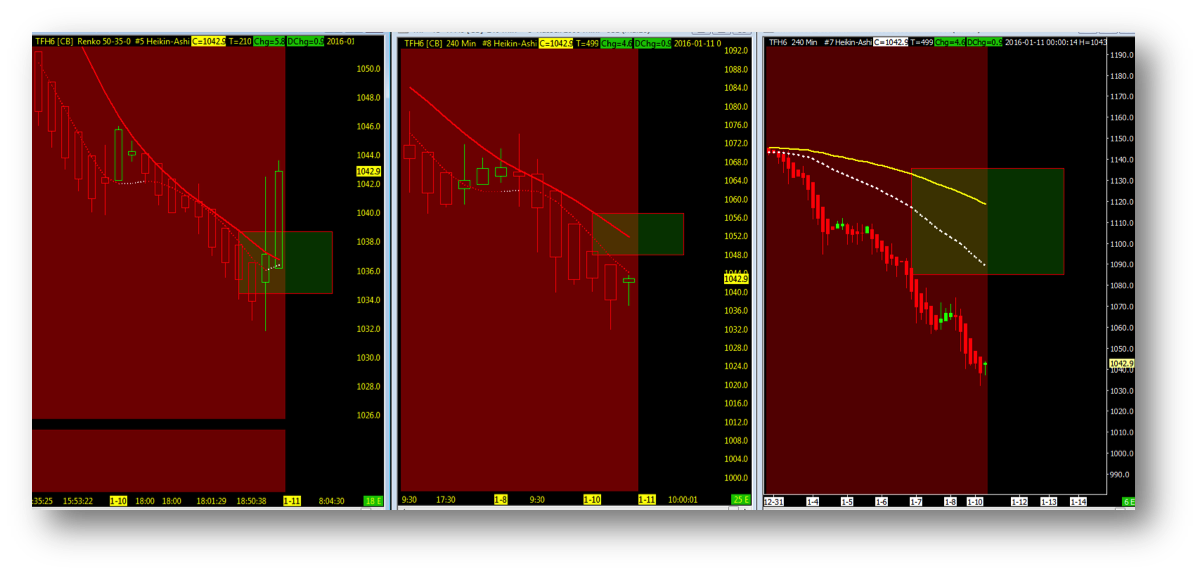
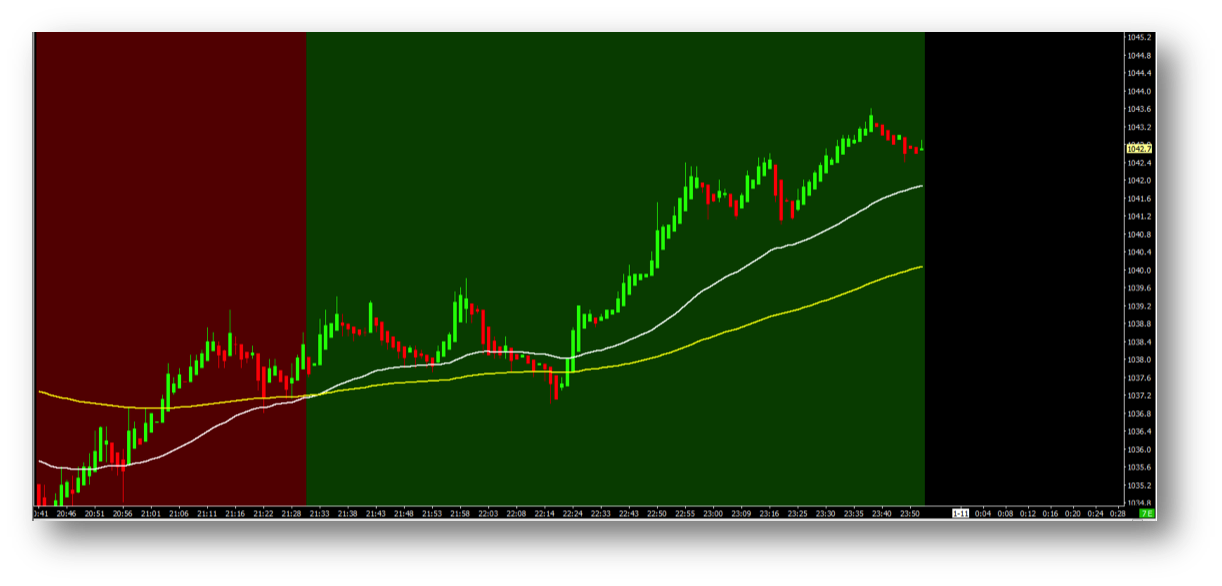
The longer term charts will not have sufficient time to change trend before the open gaps will be closed so it will be the combination of the shorter time frame range charts above and intraday setup below starting with a 50/144ema chart set to a 1 minute time frame. Seen here in a long technical bias to the bullish where the 50 ema is above the 144.
Till then, the market remains in a Technical Bias trend to the short side.
Again, I leave you with these simple words of ‘open gap’ wisdom: It’s a simple as… ALL futures indices daily open gaps eventually get filled.
Thanks for reading.
Twitter: @TradingFibz
The author trades these indices intraday and may have a position in the mentioned securities at the time of publication. Any opinions expressed herein are solely those of the author, and do not in any way represent the views or opinions of any other person or entity.


