Today, several headlines hit the market.
All gave the market happy feet.
Quietly, House Republicans extended the tax cuts for individuals to expire within a decade.
They made the tax cuts for corporations permanent.
The cuts preceded today’s trade deal with Canada and Mexico.
Elon Musk quickly settled with the SEC, allowing Tesla to get back in the bullish game.
Go ahead dancing cocks, put on your red lipstick and party.
However, why isn’t everyone rocking and rolling?
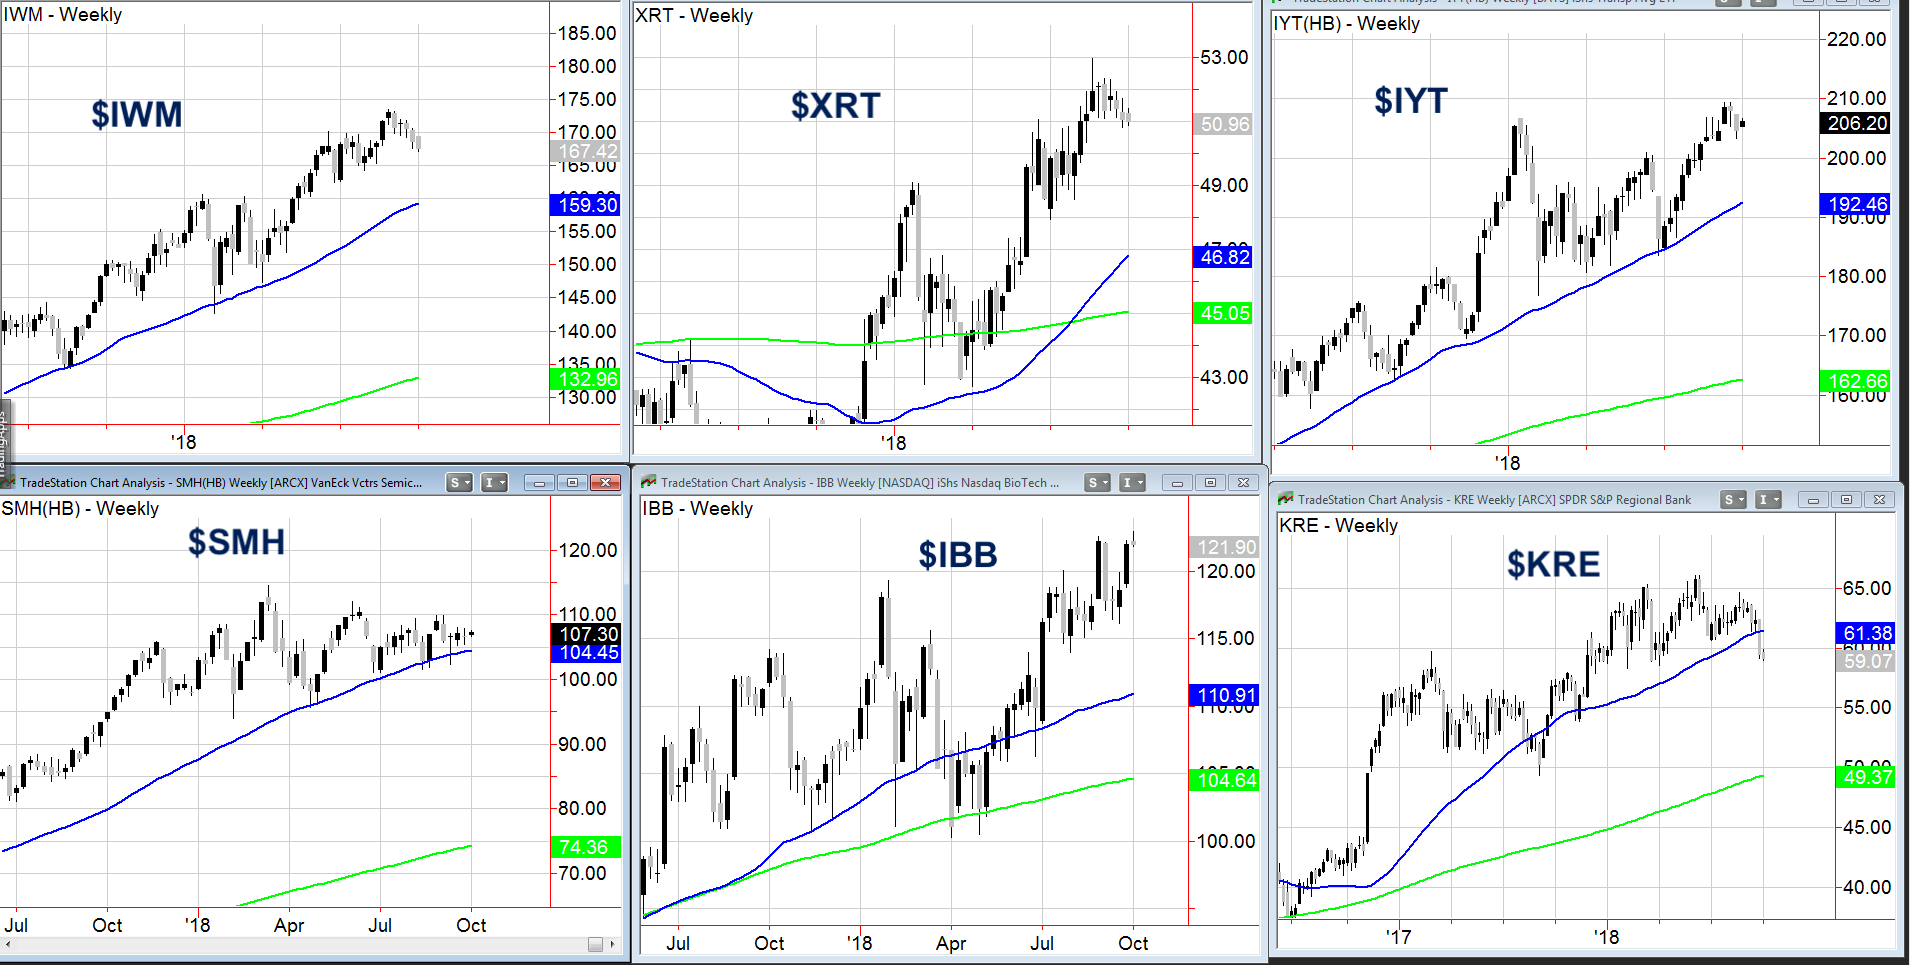
The 6 weekly charts represent the economic Modern Family.
Before we get into that though, this is a good time to remind you all that the focus on the dollar, interest rates, commodities (especially oil) and the transportation sector is still the focus.
Perhaps this can explain why in spite of the bullish headlines and 200-point dance in the Dow, not everyone was happy.
While 3 of the 4 indices rallied, the most important one not only sat out the dance, but also became a party pooper.
The Russell 2000 (IWM) declined by over 1%. It broke a key moving average, although remains well above the 50-week MA.
The US dollar and yields gained again. The treasuries (TLT) now sit on super major support. Super major. A further breakdown will engender fear.
And considering the overheated economy now overheating even more, one cannot blame the Fed for their recent actions.
Oil rallied as well. The combination hurts the consumer, which in turn hurts the small cap stocks.
Transportation (IYT) gained, yet could not clear the key resistance levels. That tells me the trade deal helped, but not by enough given the sector’s reliance on fuel.
Brick and mortar Retail (XRT) already in a warning phase, certainly reflects consumer concerns.
Semiconductors (SMH) look better this week thus far. Nevertheless, more weakness in IWM, IYT and XRT, and SMH is a sneeze away from breaking its 50-week MA.
Biotechnology IBB, made new 2018 highs early in the day. By the end of the day, it looked like a nasty reversal topping pattern.
Regional Banks (KRE) did not dance at all. On crutches, it is the only member of the family under the 50-week MA.
While we assume the dancing cock dances for equities, that assumption could turn out all wrong.
The commodities, laughing now in the face of the stronger dollar and the rates, could get going.
And that could turn our rooster into coq au vin.
Stock Market ETF Levels to Watch:
S&P 500 (SPY) 291.00 pivotal.
Russell 2000 (IWM) 167.40 pivotal resistance
Dow (DIA) Unless it takes out 267.61, its still working a topping pattern.
Nasdaq (QQQ) August high 187.52. Today’s high 187.53. Double top? We are still far off from knowing that answer
KRE (Regional Banks) Possibly a blow off bottom-possibly- need proof
SMH (Semiconductors) Unconfirmed bullish phase making 106.50 pivotal
IYT (Transportation) 206.80 resistance. A move under 202 or the 50 DMA not great
IBB (Biotechnology) 120 support to hold
XRT (Retail) The weekly MA is at 50.15
Twitter: @marketminute
The authors may have a position in the mentioned securities at the time of publication. Any opinions expressed herein are solely those of the author, and do not in any way represent the views or opinions of any other person or entity.

 Continues to Flash Caution")


