 By Andrew Nyquist
Over the past week or so, investors have been barraged with an overabundance of market “noise.” After a prolonged move to the downside, the market rallied back to a key level over a very short period of time. This brought the bulls back out on the dance floor and now has both sides puffing their chests. And this is precisely the area where investors need to take emotion out of their game and put patience and risk management into their game.
You see, the market has a memory. And a good one at that. Key technical price levels almost always lead to volatility, indecision, and big moves. And it is precisely at these times that investors are susceptible to outsized positions and risk.
So, is this sideways move indicative of a healthy rest before a burst higher? Or is the price action simply grinding below key resistance and setting up for a move lower? My thoughts lie somewhere in between (and my positioning, for better or worse, resembles them). As many of you know, I’m a technical guy. And I tend to follow the S&P 500 as my go-to index for macro technical guidance. I have plenty to say on the fundamental side, but as an active investor, I am always scanning for entry and exit points based off current price action and key support and resistance. That said, let’s get technical.
On November 25th, I highlighted a key band of S&P 500 resistance. Here’s an excerpt from that blog:
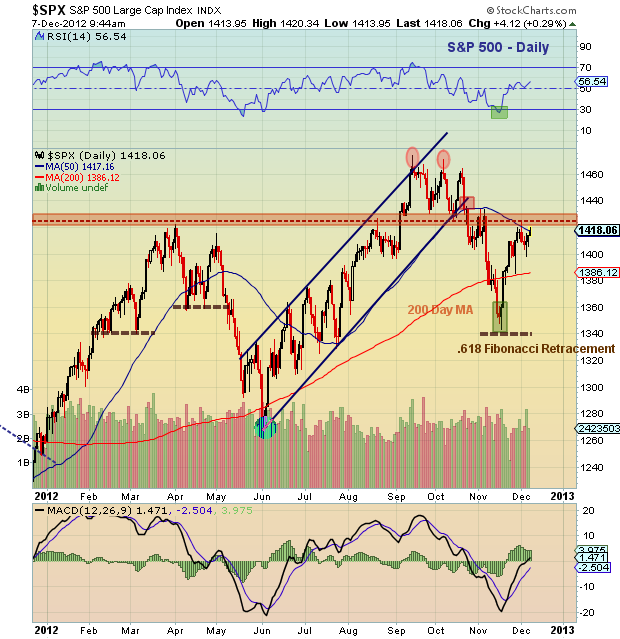
“1420-1430 is a pivot congestion zone that should put up formidable resistance. More precisely, the 50 day moving average and 61.8% Fibonacci [up] retracement level reside at 1426, so keep an eye on the price action in and around this level. This would be an ideal spot for a rest. A sustained move through this level would be bullish, while a move back below the 200 day moving average would return caution.”
I still feel the same way about the S&P 500 and will keep my positions right-sized until I receive directional confirmation. See chart below.
S&P 500 Daily Bar Chart:
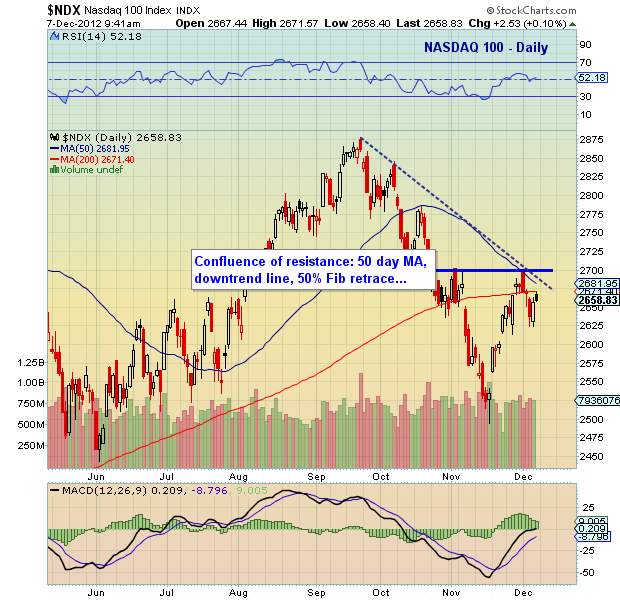
Looking at the Tech sector and using the Nasdaq 100 as my guide, I see a similar type of technical set up. The index is holding below a key confluence of resistance between 2670-2695. This band of resistance includes the 50 and 200 day moving averages, the near-term downtrend line, and the 50 percent Fibonacci retracement level. That said, I believe a move through 2700 would be constructive (bullish), whereas a move below 2625 would be a sign of caution (bearish). See chart below.
Nasdaq 100 Daily Bar Chart:
Trade safe, trade disciplined. And have a great weekend.
———————————————————
Twitter: @andrewnyquist and @seeitmarket Facebook: See It Market
No position in any of the securities mentioned at the time of publication.
Any opinions expressed herein are solely those of the author, and do not in any way represent the views or opinions of his employer or any other person or entity.


