The equity markets declined for the second week in a row last week. The S&P 500 Index is now ahead by less than 1.0% this year. The catalyst for the weakness in the stock market is the continuation of slowing economic data and the long-string of declining corporate earnings numbers.
This has generated a host of negative sentiment on both Wall Street and Main Street in recent weeks. While the focus on Friday was on the April jobs data that fell short of estimates, encouragement was found in other economic data, as the ISM Non-Manufacturing Index (NMI) that climbed for the second month in a row in April and is sitting at the highest level of the year.
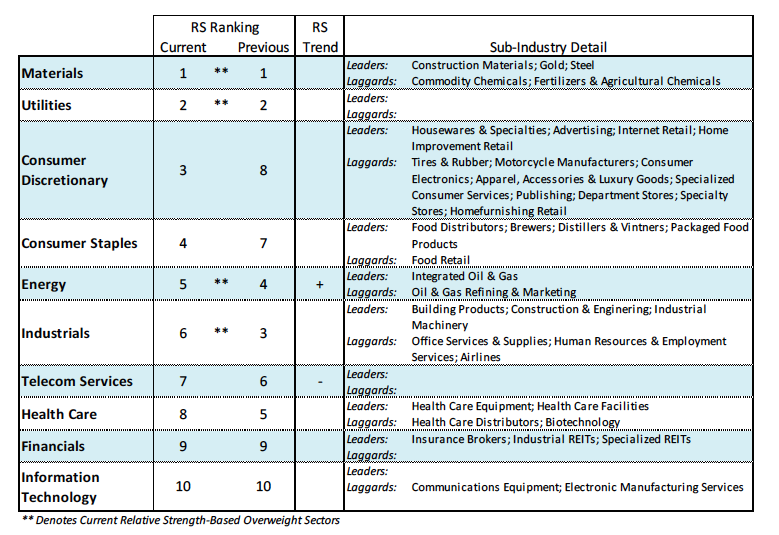
Supporting the view that the economy is not as vulnerable as the drop in confidence suggests is the improvement found in the performance of the consumer sectors of the stock market that have catapulted to the top of the relative strength rankings.
The stock market entered this week oversold and under believed. Short term, this is a bullish configuration that argues for another test of the upper bracket of the 2075 to 2100 trading range on the S&P 500 Index.
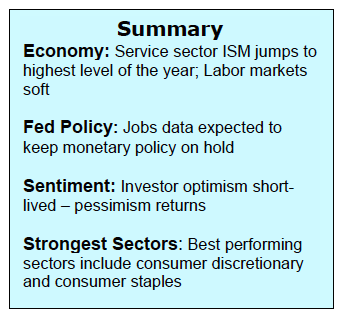
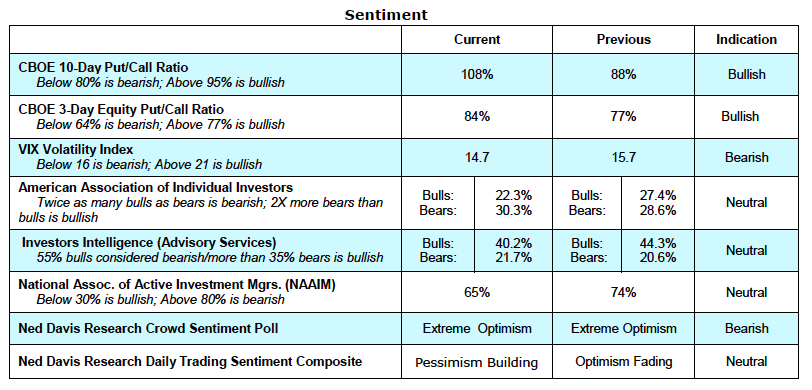
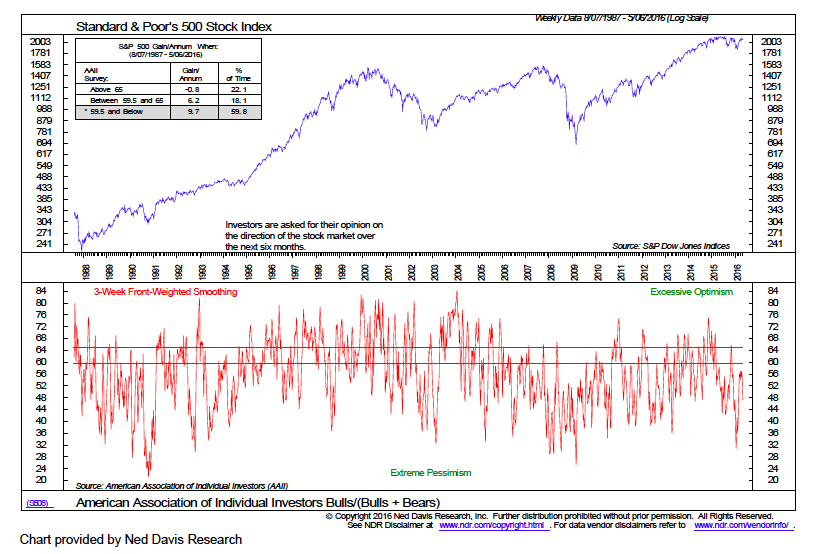
The relatively tight trading range over the past several weeks has functioned to relieve the overbought condition seen in April and caused the mood of investors to turn south. Investor optimism that briefly turned positive vanished last week. The most recent data from the American Association of Individual Investors (AAII) shows only 22% bulls versus 30% bears. The percentage of bulls in the AAII survey is the fewest since the bottom in February. The Chicago Board of Options Exchange (CBOE) showed a surge in the demand for put options last week (put buyers anticipate lower stock prices). As a result the 10-day CBOE put/call ratio and the 3-day equity put/call ratio ratcheted sharply higher and have moved from neutral to bullish. In addition, the latest mutual fund data shows the heaviest selling of stocks since mid-December 2015. Despite the recent weakness in the popular averages, the trend in the broad market remains positive. This, plus the weight of the sentiment indicators, suggests the path of least resistance is to the upside.
Thanks for reading.
Further reading: Rapid Sector Rotation Boosts Energy & Materials
Twitter: @WillieDelwiche
Any opinions expressed herein are solely those of the author, and do not in any way represent the views or opinions of any other person or entity.

: Showing Some Signs of Emerging Strength")
