Key Stock Market Rally Takeaways:
– Ongoing volatility reduces value of price signals
– Mega-caps lead but other areas not following
– Time needed to build base of support for sustainable uptrend
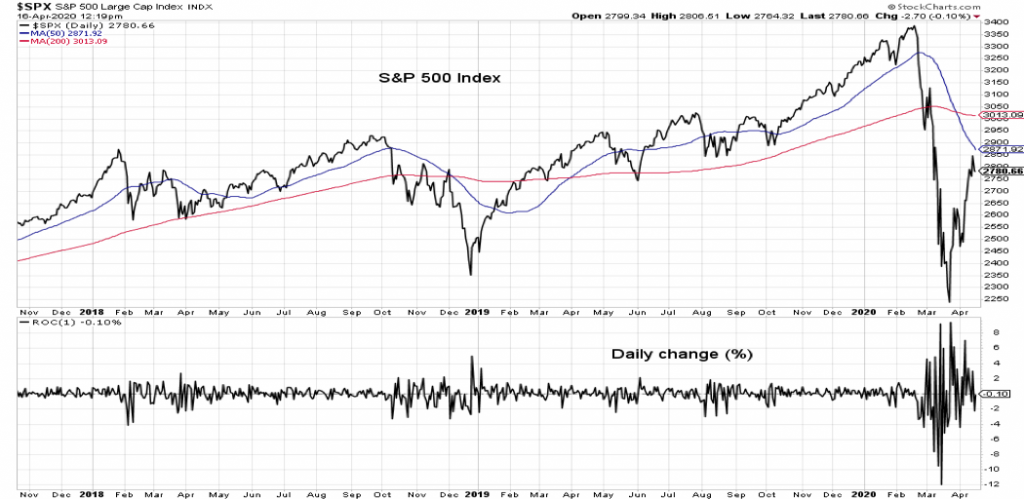
At times gauging the health of a rally might be as straightforward as looking at price trends. The S&P 500 fell 34% from its February peak to its March low and rallied 27% from that level to its recent peak (earlier this week). Both the selling in March and rallying in April went further than many were expecting.
While price gains and losses garner headlines, price can also reflect emotion. While its useful to lean on history to provide investors with useful context, each episode, however, has its own distortions and a signature that makes it unique.
This episode’s signature is likely the abruptness with which financial market and economic weakness have emerged and the volatility that has ensued.
Because of this volatility, price moves alone may not be a good measure of rally strength. Absent some re-scaling, daily price moves over the past two months (both to the upside and the downside) would have been literally off the chart. Some perspective, the maximum peak-to-trough decline for all of 2017 was an exceptionally low 2.8%. Fourteen different individual trading days over the past two months have seen single-day declines in excess of that (there have also been eleven trading days with gains in excess of 2.8%).
The point is that volatility is exaggerating the moves seen in the stock market and reducing some of the usefulness of price signals. In such a situation, we can look beyond just price to see what is happening beneath the surface of the market and between various segments of the financial markets.
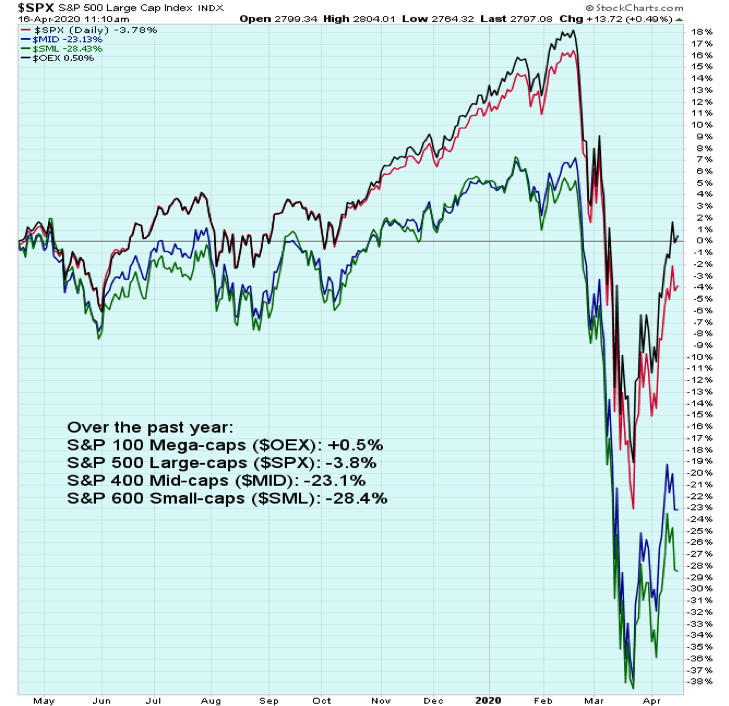
History shows that small-caps bear the brunt of the weakness during downturns but then lead on the way out of recession-related bear markets. The pattern of the past year shows mega-caps and large-caps holding up much better than their mid-cap and small-cap brethren. This can be seen across indexes (as in the chart to the right) and also within indexes. The S&P 500 overall is down 4% over the past year but this masks a divergence between six strong performers that are up 25% over in that time period and the remainder of the index (494 stocks) that is down 9% overall. Relative weakness in small-caps versus large-caps is more consistent with a bounce off of the lows than a sustainable turn in the longer-term trend.
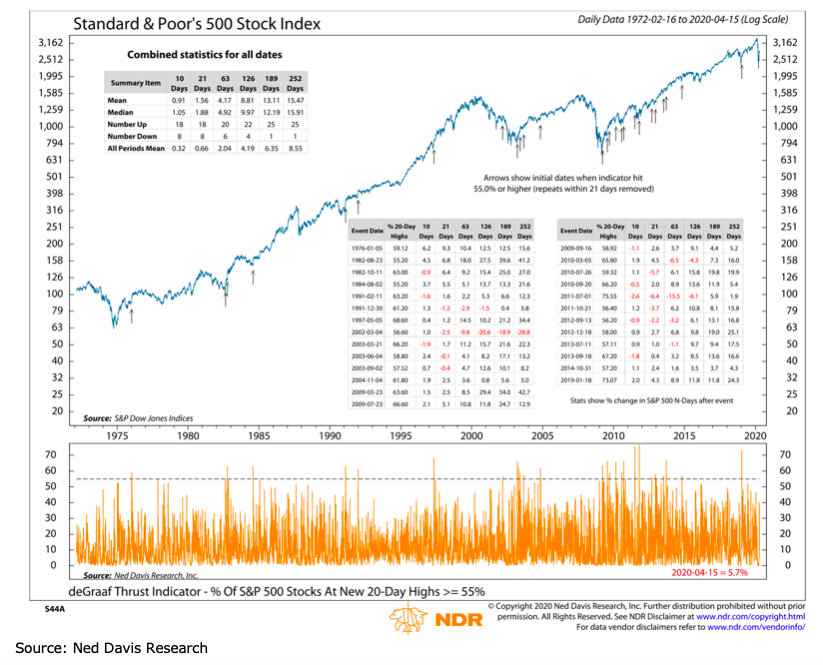
The volatility of the recent price moves can add to some seemingly conflicting indications from a breadth perspective as well. For example, while Strategas Research points out that 99% of stocks have moved above their 20-day averages, the percentage of stocks making new 20-day highs has not even reached 50%. Getting this above 55% would provide further evidence of broad-market healing that is necessary to support a sustained price rally. While some of the faster moving indicators are showing strength, they are also prone to early signals. We want to follow a sustained trend higher.
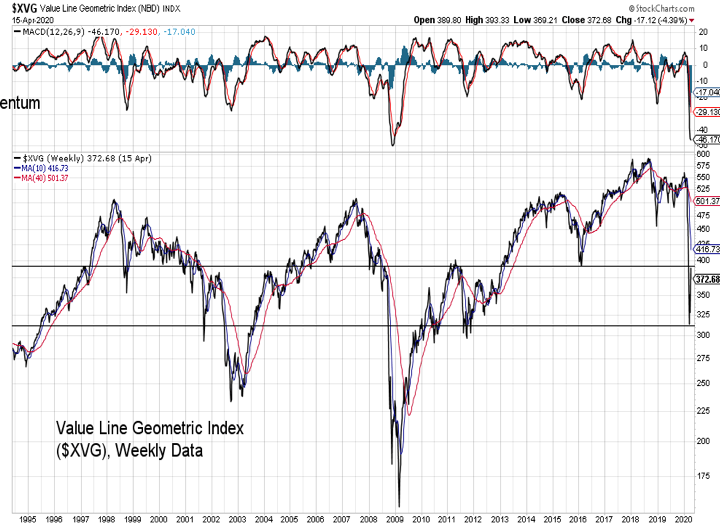
Some things become most obvious in retrospect. The failure of the Value Line Geometric Index to join other indexes in making a new high in 2019 seems now like an obvious warning sign. As such, it is hard to look past its decline in 2020 to a level it first crossed in the mid-1990’s. This broad index which reflects the price move of the median stocks has endured substantial damage from both a price and momentum perspective. While price swings have been rapid over the past two months, time may be an underappreciated element needed for healing and repair to occur.
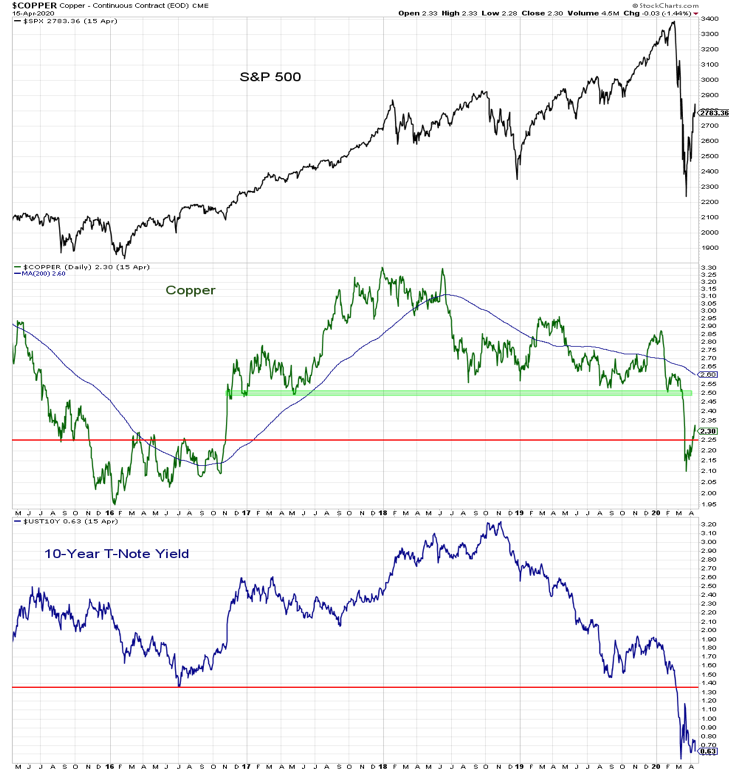
In addition to seeing improving conditions within the stock market and between various areas of the stock market, the robustness of a rally can be evaluated across various financial assets. The price improvement in the S&P 500 since its March low has outpaced the move in copper prices and bond yields. A sustainable ascent for stocks will likely not only have broad underlying support from a breadth perspective, but also be accompanied by higher copper prices and rising bond yields. Copper has moved off of its lows, but is hardly strong (especially when compared to gold). Bond yields have struggled to move higher at all.
Twitter: @WillieDelwiche
Any opinions expressed herein are solely those of the author, and do not in any way represent the views or opinions of any other person or entity.

: Showing Some Signs of Emerging Strength")

