The Index Futures Market – Big Picture
I think it’s helpful to go back over the prior week of trading action and review the setups that occurred. Sometimes taking a step back allows traders to see the market in slow motion and better understand where stocks may be headed (and stock market futures).
I think this also allows for higher probability trading setups because we have a better overall idea of market structure and trend. Your patience and discipline as a trader will continue to grow when you implement such practices.
Okay, let’s start the review what happened and finish with a look ahead on key stock market futures indices. Note that you can watch my weekly review video here.
Stock Market Futures: Looking at the week behind…
Six weeks into the year and these five days had volatility and flatness written ALL over it. Not just on the Russell 2000 Futures (TF) but on all 3 stock market futures indices. With Janet Yellen’s testimony on Wednesday and Thursday, price session overnight gaping down and never going higher made for some very tough sessions, especially for intra-day TREND traders.
Finding pockets of opportunity may mean waiting and waiting and waiting for the setup until everything looks perfect… and sometimes the trade still does a 180 on you. Yes, that did occur and is most likely the core reason for the majority of any losses this week.
However, when the trend did run this week, it made up quite substantially for any losses and the same premise will continue into this week.
A Quick Note On ETF’s
In conjunction with the stock market futures indices, ETF’s including Gold (GLD), US Oil (USO) and the Euro (FXE) are an opportunity to not just trade intraday but for the short to long term as well. Combined with the Jason Kelly 3% re-balancing can make for a very powerful strategy. Timing is everything when it comes to the markets and being ready for the momentum crossover can put you into a long term trade and learning how to remain in the TREND is the goal.
Equities: Market Cap Leaders
Utilizing the same T3 strategy for futures, I review the top 6 Market Cap Leaders and assess current market TREND opportunities for NFLX, FB, AMZN, GOOG, AAPL and SBUX. Whether you trade the options, swing or intraday position, the big picture will allow you to assess potential greater probability entries based on market momentum.
Watch the video link above for a chart by chart walk through starting at about 22:00. Beginning in March I will also begin a FREE weekly newsletter that will include the weekly analysis of each of the mentioned above.
As a follower of @Jasonkelly for some long term strategies, I will begin in March every month to review some of the holdings that can be easily managed 4 times per year without concerning yourself with the intraday volatility of the market.
Stock Market Futures: Looking at the week ahead…
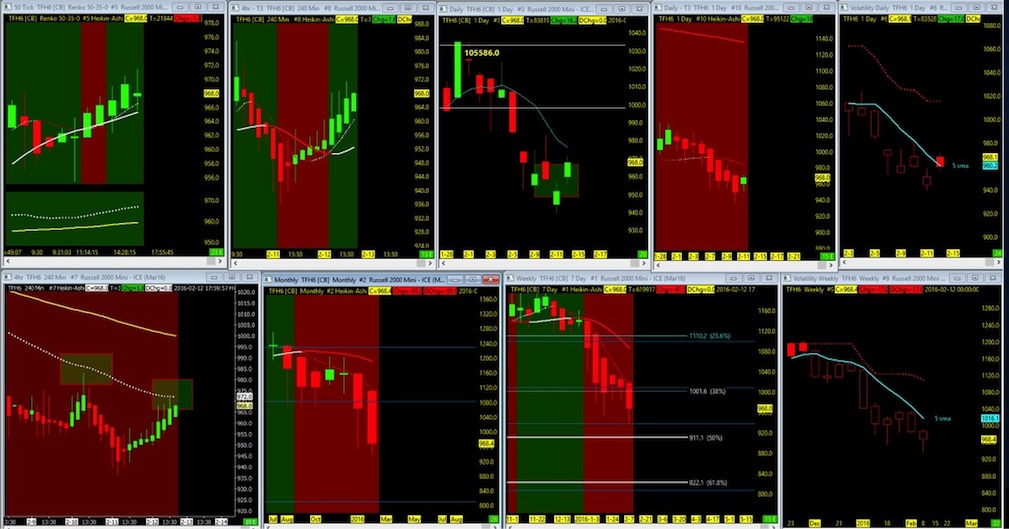
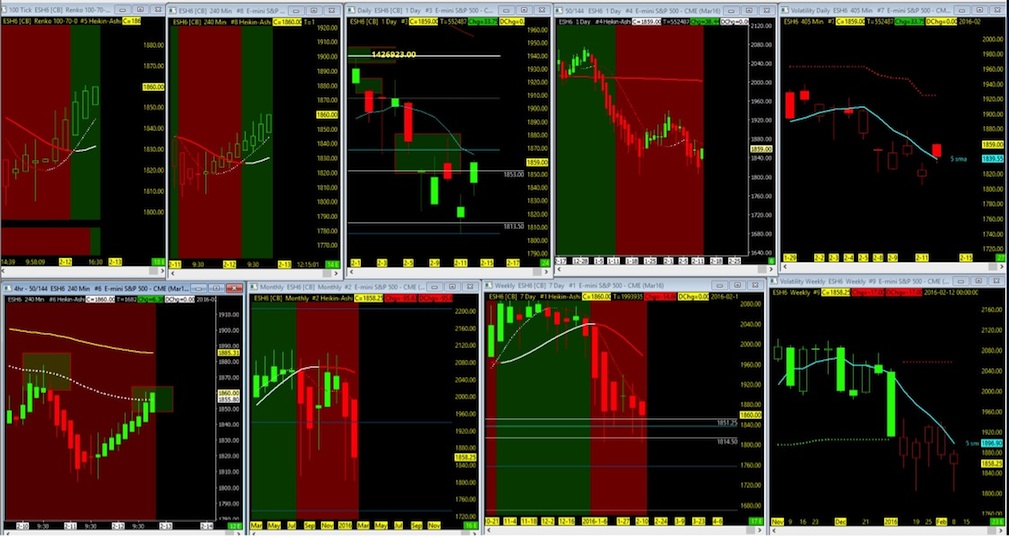
Hopefully not a repeat of this last week, price action lifting on Friday may give us a small rally if we can hold above the 50/144 on the four hour chart. As reviewed in the video, significant resistance now lies at the 50 day ema, and we will need to follow through to at least the 144ema before we see additional resistance. While upside open gaps seem to be a reliable short term target, it will be the combination of the Globex and intraday trend that will enable the market to lift higher. Weekly and monthly pictures remain in a downtrend.
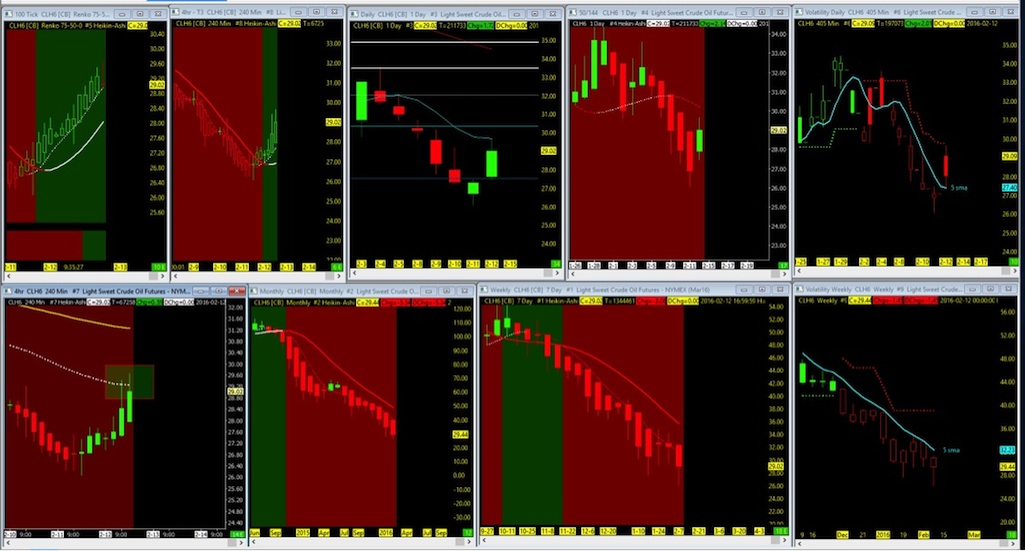
Crude oil remains in a non-contested technical bearish trend. The only hopes at this point of moving back up into the 40’s would be on rumors coming true of production cuts. If then, open gaps above at 33.74., 36.71 and 48.74 will be in my scopes.
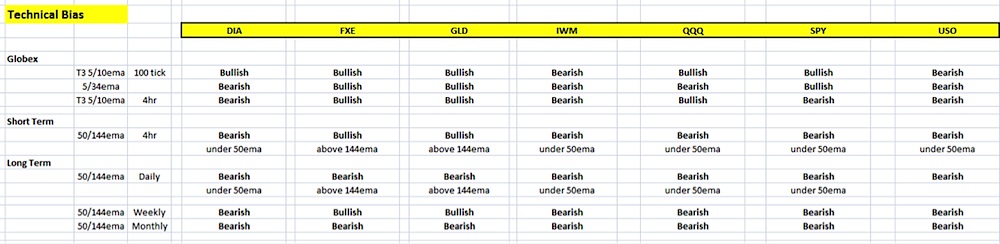
My Technical Bias & Charts leading into the third week of February
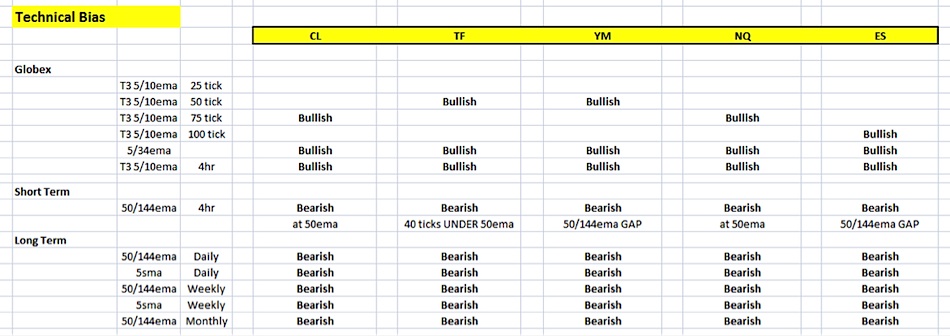
Big Picture Charts as of the close of Friday 2.12.16
TF – Russell 2000 Futures
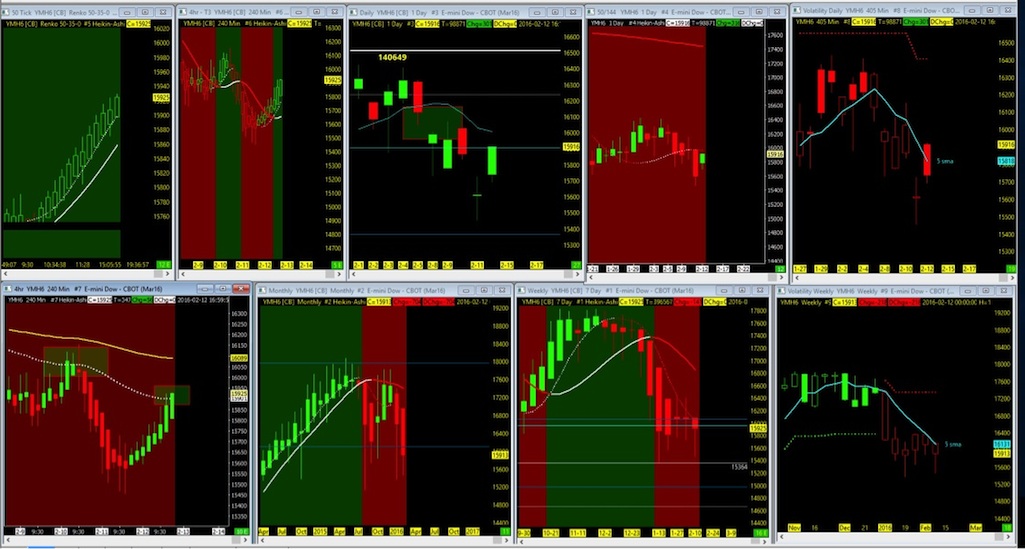
YM – Dow Jones Futures
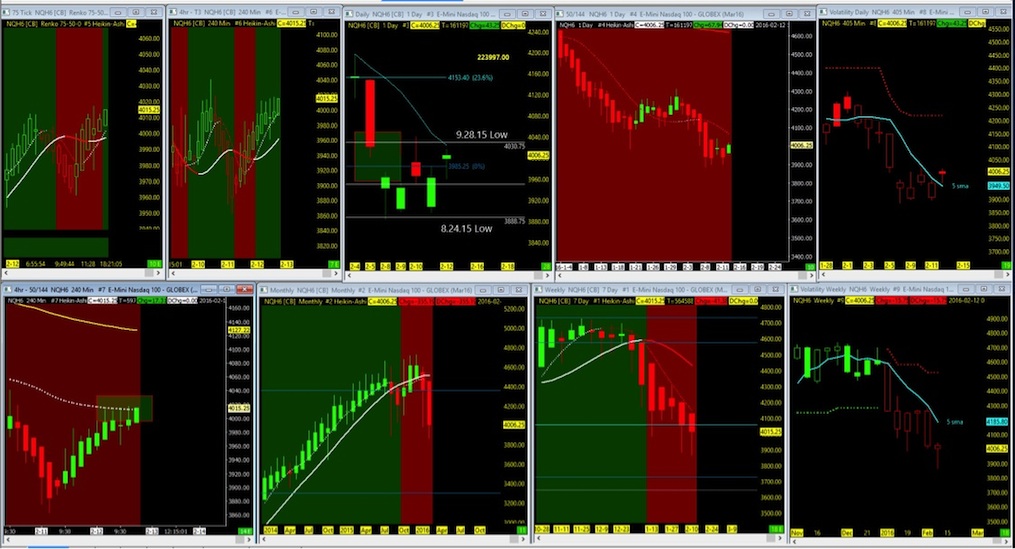
NQ – Nasdaq Futures
ES – S&P 500 Futures
CL – Crude Oil Futures
Index ETF’s seem to also have their work cut out for them as price action on the 50/144ema chart is at key resistance at the 50ema. The Euro ETF (FXE), a great example for a breakout above the 144 is a prime example of what we are looking for in the US index futures. So watch for the reversal if we go up. Timing in GLD is overthinking and while the entry was some weeks back, another opportunity will arise. Watch the moving averages and my twitter posts for any change in trend.
My Technical Bias on ETF’s leading into the 3rd week of February
Thanks for reading and have a great week.
Twitter: @TradingFibz
The author trades these indices intraday and may have a position in the mentioned securities at the time of publication. Any opinions expressed herein are solely those of the author, and do not in any way represent the views or opinions of any other person or entity.

: Worrisome to Broader Market?")


