THE BIG PICTURE
Did you remember to breathe last week as I instructed? (insert smiley face)
Without a doubt it took a lot of patience in week five of 2017, as a vast amount of data & news was tossed around the marketplace. Unless you learn to be patient, disciplined and follow your trading plan, the volatility alone can chew you up and spit you out.
Remaining calm and collected allows the market to serve you pockets of trend (opportunities). I know, it can be very frustrating entering into a day session after a good overnight run, only to chop and eventually pullback.
If you are a follower of my blog, articles and/or daily charts, you are aware of what a high probability setup appears like when price is in momentum. You may also be privy to what it takes to ride a momentum wave once in it. The key for every setup is patience and discipline. Hoping is not a technical indicator so a solid trading plan includes trade management and an awareness to act in either direction.
Being ready for both directions seems to be the ever growing sentiment in the INDICES as an increasing amount of investors in the VIX etf’s pile in and pessimism continues to build as stated by a most recent data poll by AAII. With market euphoria continuing to hold at new highs and earnings that appear to be doing well, it is no wonder that the interest has peaked. For the intraday trader, you may wonder on any given day if there are any traders left in the market as volume seems to come to a dead stall for hours. Rest assured, they are there.
Looking ahead to week 6: On the economic front, we ease back from last week and market is able to digest the recent data and new earnings coming out. Surely the push up on Friday of the non-farm payrolls was the catalyst the market needed to regain the upper levels. Technically on the charts, we are at a pause from previous highs and without any defining news moment out of Washington or the world at hand, we have room to move up. To the downside, I’ll continue to monitor the VIX open interest strike prices of 21-23 for Feb15 which may lead the market for a pullback in the next two weeks to key lower MMl levels and open gaps. I’ll be watching those first 2.5 hours of the US session, and will use the PM session to manage any prior entries.
Bottom Line
Technical momentum probability CONTINUES to remain at this point to lead us a bit higher on the indices “with caution” on the bigger pic in my humble opinion if all things remain constant and nothing occurs to shake things up downside as stated over the last several weeks. At this point it won’t take much! I state with caution as seen in the charts below we are at a technical momentum decision time as we were last week based on my strategy that puts price action in a stall at these levels.
Note that you can also view my market outlook for ES, YM, and NQ on YouTube.
Attempting to determine which way a market will go on any given day is merely a guess in which some will get it right and some will get it wrong. Being prepared in either direction intraday for the strongest probable trend is by plotting your longer term charts and utilizing an indicator of choice on the lower time frame to identify the setup and remaining in the trade that much longer. Any chart posted here is merely a snapshot of current technical momentum and not indicative of where price may lead forward.
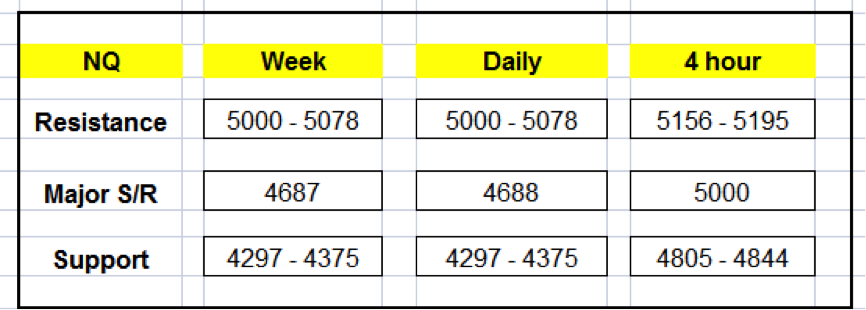
Nasdaq Futures (NQ)
Technical Momentum: UPTREND
Using the Murray Math Level (MML) charts on higher time frames can be a useful market internal tool as price action moves amongst fractal levels from hourly to daily charts. Confluence of levels may be levels of support/resistance or opportunities for a breakout move.
CHARTS: Weekly, Daily; 4hour
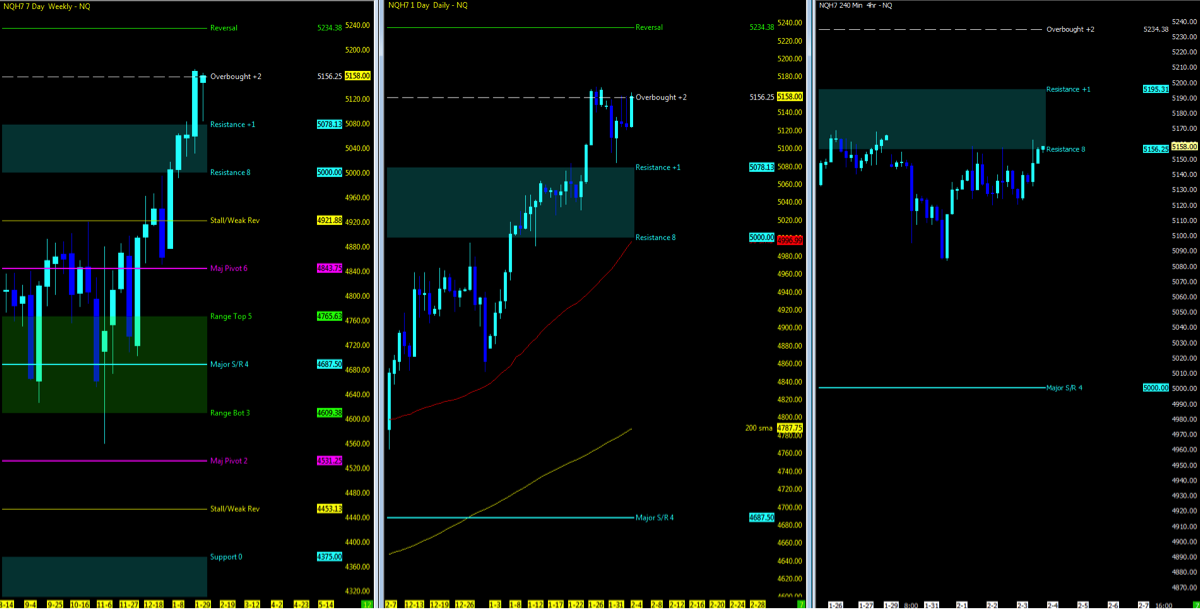
MML Levels (NQ)
Nearest Open Daily Gap: 5121.25
Lowest Open Gap: 4017
continue reading on the next page…

: Showing Some Signs of Emerging Strength")
