THE BIG PICTURE
We’ve seen seven relentless trending weeks to the upside to start 2017. And last week was par for the course – the S&P 500 (INDEXSP:.INX) and Nasdaq (INDEXNASDAQ:.IXIC) closed at new all-time highs. In all, it’s been 15 weeks of nothing but one direction in the major US stock indices. This market refuses to entertain a pullback at this time.
Last week I alluded to an analogy of the market these past weeks like an orange being squeezed for every last pulp. It appears that while the bottom line picture last week was a continued uptrend (cautiously), the market continues to desire every last pulp out of this run. Could this be the week where markets finally ease off? Is week eight of 2017 finally going to be the one that gives us a bit of reprieve and “breathing” room to pull back and let the market digest?
I must say I have been thoroughly entertained by the numerous articles, tweets and posts by the Permabears and to those that finally could not hedge short any longer. Article after article covering everything from the VIX to the HFXAX (small cap futures hedge) raising cause of why the markets should pullback. Even I was drawn into watching the VIX FEB15 strike calls with Open Interest sitting at 1 million around 20-23. Seemed like a reasonable awareness given the relentless run and thinking perhaps those VIX levels may just rise to be in the money. Then again, perhaps just an insurance hedge in this upside run which ended being out of the money.
While the intraday charts are all I need to guide me in the TREND, looking ahead is simply knowing what obstacles in the market may give rise to any potential change of course. For instance, one may get in their car on any given day and be prepared to drive down the road on cruise, but what lies around the corner will only be known when it arrives… and we encounter any unforeseen events. Sure, you can decide to simply turn around and go the other way or travel much slower as you drive, but your management both as a driver on the road and as a trader in the market should prepare you for every situation.
Technically the trend has been strong and any trend study will surely note the same. As we continue to push to new highs, I turn to my most reliable indicator: the Heikin Ashi trend bars on both the range charts and 15/60m MML levels.
If we do turn lower, there are plenty of open gaps below, MML, Fib levels and 50/200 day moving averages to retrace to (and put on your radar).
But until then… we must leave our bias at the door. We need to simply watch the charts in front of us – they will put us in a place of being ready in both directions. As Livermore said, we are all looking for someone to tell us what to do in the markets. I encourage you to stop looking for someone to tell you which way the market trend is headed next week as not one single person knows what lies around the corner until we get there. Follow price, use your indicators and manage risk.
Note that you can also view my market outlook for ES, YM, and NQ on YouTube.
Attempting to determine which way a market will go on any given day is merely a guess in which some will get it right and some will get it wrong. Being prepared in either direction intraday for the strongest probable trend is by plotting your longer term charts and utilizing an indicator of choice on the lower time frame to identify the setup and remaining in the trade that much longer. Any chart posted here is merely a snapshot of current technical momentum and not indicative of where price may lead forward.
NQ – Nasdaq Futures
Technical Momentum: UPTREND
Using the Murray Math Level (MML) charts on higher time frames can be a useful market internal tool as price action moves amongst fractal levels from hourly to daily charts. Confluence of levels may be levels of support/resistance or opportunities for a breakout move.
CHART: Daily; 4 hour
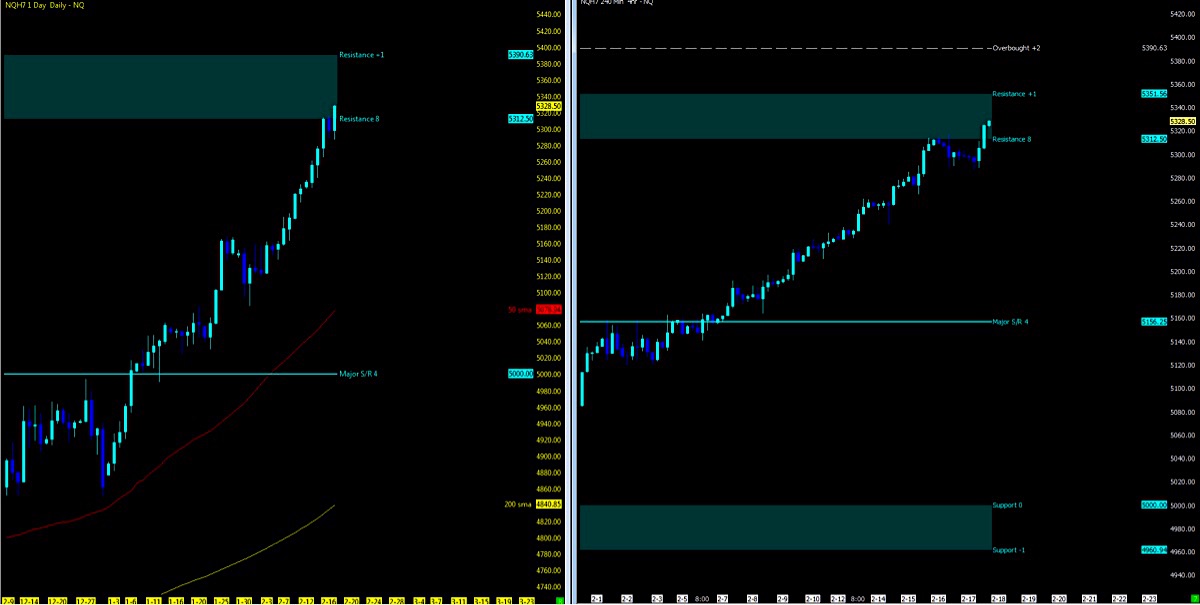
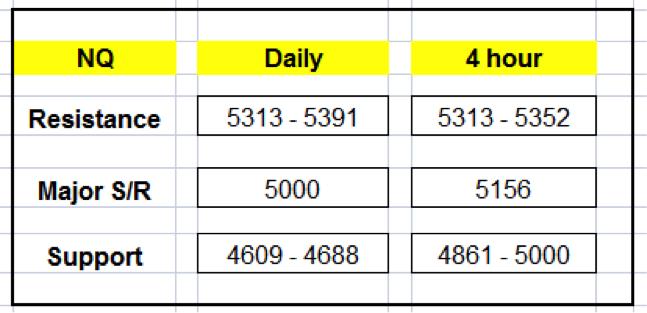
MML Levels (NQ)
Nearest Open Daily Gap: 5232.5
Lowest Open Gap: 4017
ES – S&P Futures
Technical Momentum: UPTREND
CHART: Daily; 4 hour
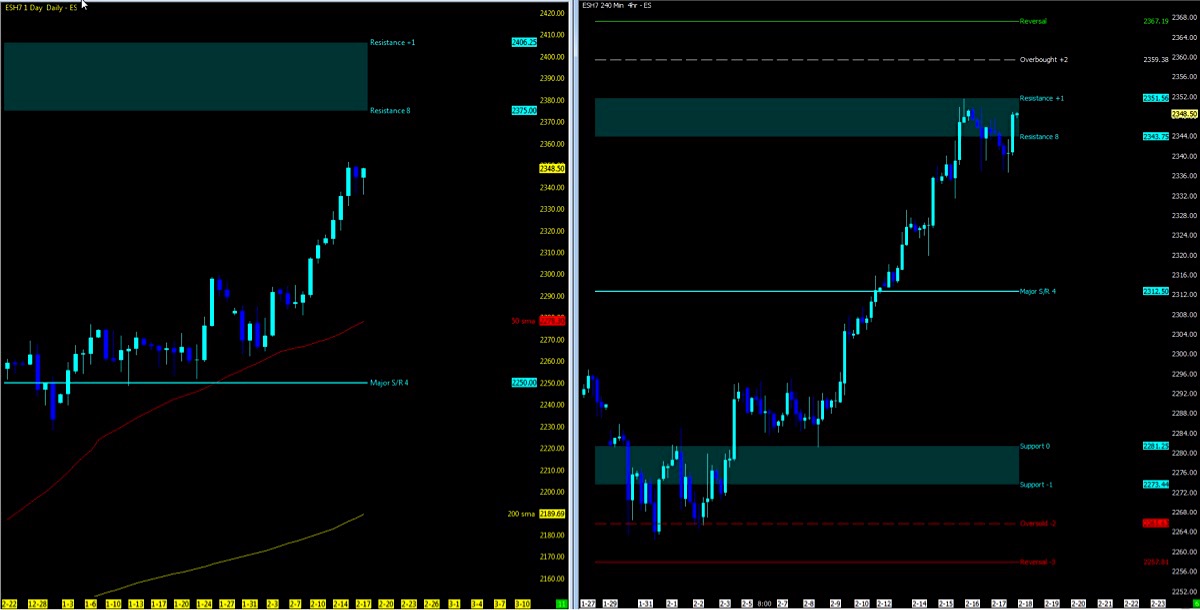
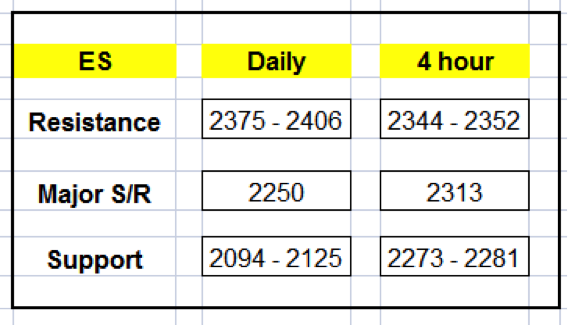
MML Levels (ES)
Nearest Open Daily Gap: 2315.75
Lowest Open Gap: 1860.75
Thanks for reading and remember to always use a stop at/around key technical trend levels.
Twitter: @TradingFibz
The author trades futures intraday and may have a position in the mentioned securities at the time of publication. Any opinions expressed herein are solely those of the author, and do not in any way represent the views or opinions of any other person or entity.


