THE BIG PICTURE
The major stock market indexes continue to trend higher and remain in strong uptrends. The Nasdaq showed particular strength last week and will carry that momentum forward this week. Although we remain in an overbought condition and overdue for a pullback, the best thing for traders to do is follow the price action and avoid getting caught up in the noise and anticipating the next move. If/When we enter a market pullback, your process should stop you out of the trade… or offer new looks on both the long & short side.
Here’s my weekly futures trading update and outlook. We’ll start by taking a look at the S&P 500 (NYSEARCA:SPY).
S&P 500 ETF (SPY) Chart – Week 44 (week of November 6)
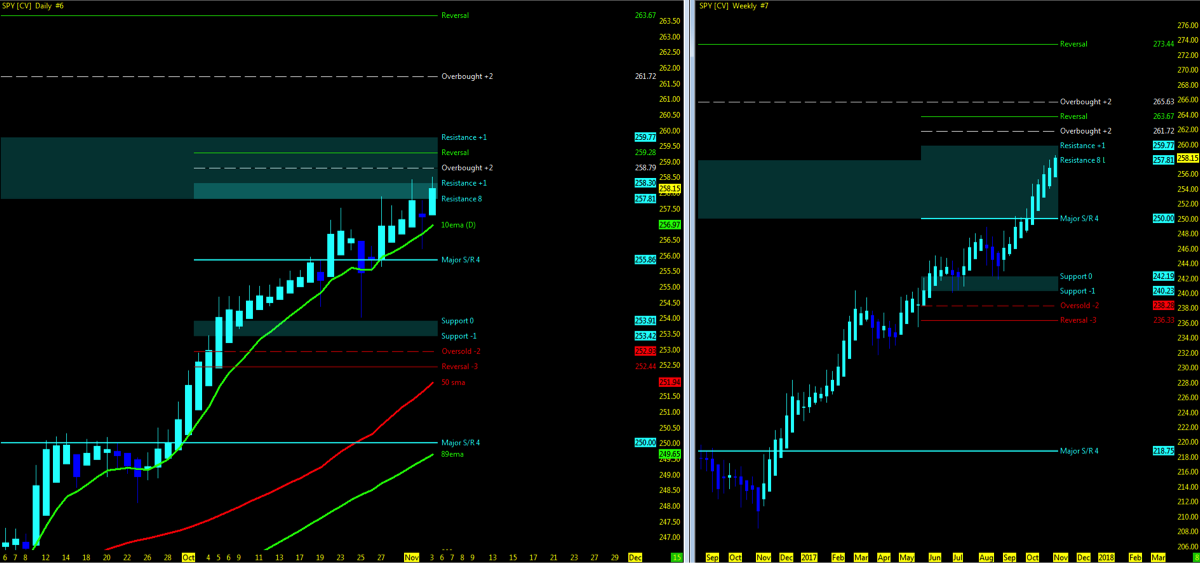
A Note On Using MML Charts: Using the Murray Math Level (MML) charts on higher time frames can be a useful market internal tool as price action moves among fractal levels from hourly to weekly charts. Confluence of levels may be levels of support/resistance or opportunities for a breakout move. Optimal setups will pass through Resistance or Support prior to moving in the opposite trend.
Technical Trends
- Check out my week 44 recap and trend charts
- The Nasdaq (INDEXNASDAQ:.IXIC), Dow Jones Industrial Average (INDEXDJX:.DJI), S&P 500 momentum are at all time highs
- Russell 2000 (INDEXRUSSELL:RUT) is 24 points off ATH and in consolidation
- Open gaps remain downside on all 4 stock market indices
- VIX Volatility Index (INDEXCBOE:VIX) levels holding at sub-9
- FANG/FAAMG stocks making all new highs on positive earnings
- Current IBD Outlook: Still in a confirmed uptrend
Key Events in the Market This Week
- USA: JOLT’s
- GLOBAL: China CPI
- Q4 Earnings Season
- NVDA, DIS, SNAP
- TD Ameritrade Investment index
- Chip makers, Chinese internet Leaders report this week
- Macy’s/Nordstrom/Kohl’s earnings
THE BOTTOM LINE
Technical Momentum probability on the indices remains in an UPTREND.
The stock market indices are holding at MML highs and pushing projection levels higher as price makes new all time highs. The short term 10ema will be first indicator of a pullback followed by a trending candle close below resistance. With a quiet economic week ahead and earnings alone to move the market in either direction, market may stall. Always ready for geo-political waves to put the scare in investors/traders.
October perma-bears remain in their caves for now. With earnings season now in full session and the Nasdaq market cap leaders reporting positive earnings and econ data, momentum remains upside. FANG/FAAMG stocks having a positive Q3, may continue to push the NQ higher. Dollar index (UUP ETF) downside momentum in a pullback and watching for 25 if able to breakout of 24.76, otherwise, line in the sand at short term MML 24.71.
Murray Math levels continue to project higher short-term resistance levels as momentum drives higher. Weekly charts at or approaching MML Overbought/Reversal levels with the NQ now above resistance low.
Watch for MML setups on price action break above resistance high and back under resistance low for first signs of a pullback. Downside, watch for open gaps to be closed and 50% pullback as 1st level of support.
Attempting to determine which way a market will go on any given day is merely a guess in which some will get it right and some will get it wrong. Being prepared in either direction intraday for the strongest probable trend is by plotting your longer term charts and utilizing an indicator of choice on the lower time frame to identify the setup and remaining in the trade that much longer. Any chart posted here is merely a snapshot of current technical momentum and not indicative of where price may lead forward.
Thanks for reading and remember to always use a stop at/around key technical trend levels.
Twitter: @TradingFibz
The author trades futures intraday and may have a position in the mentioned securities at the time of publication. Any opinions expressed herein are solely those of the author, and do not in any way represent the views or opinions of any other person or entity.


