Broad Stock Market Outlook for February 7, 2018
Tuesday’s bounce turned into an upward sling shot with volume that tested price resistance near 2697 – around 150 points (600 ticks from the low).
The market is now trying to settle out and consolidate (i.e. find its footing after a big fall). Traders should watch the 2697 price resistance area to see if buyers can remain in control.
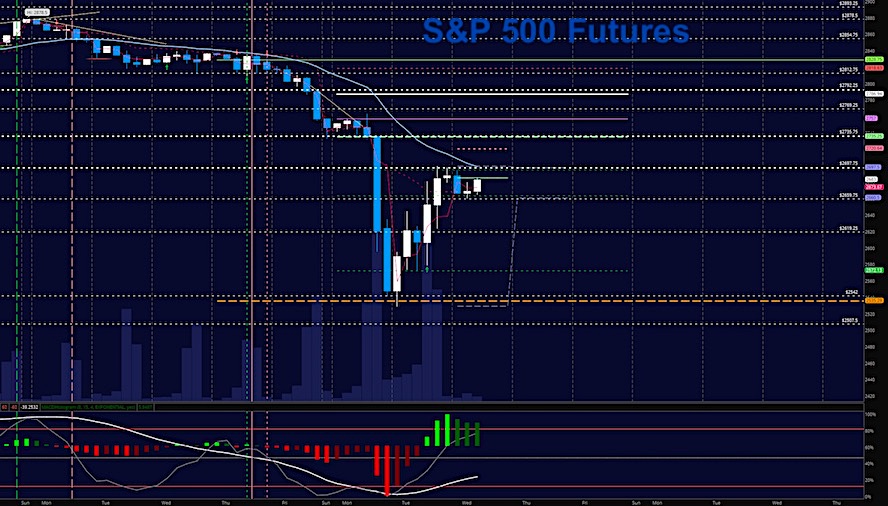
S&P 500 Futures
If buyers can’t hold higher support level bounces near 2619 or 2659, we’ll have sellers in clear power. Momentum is now mixed as cross currents of buyers and sellers sort through the level. The bullets below represent the likely shift of trading momentum at the positive or failed retests at the levels noted.
- Buying pressure intraday will likely strengthen with a positive retest of 2702.75
- Selling pressure intraday will likely strengthen with a failed retest of 2659
- Resistance sits near 2684.75 to 2697.5, with 2721.25 and 2735.5 above that.
- Support sits between 2622.5 and 2561.5, with 2542.25 and 2529.5 below that.
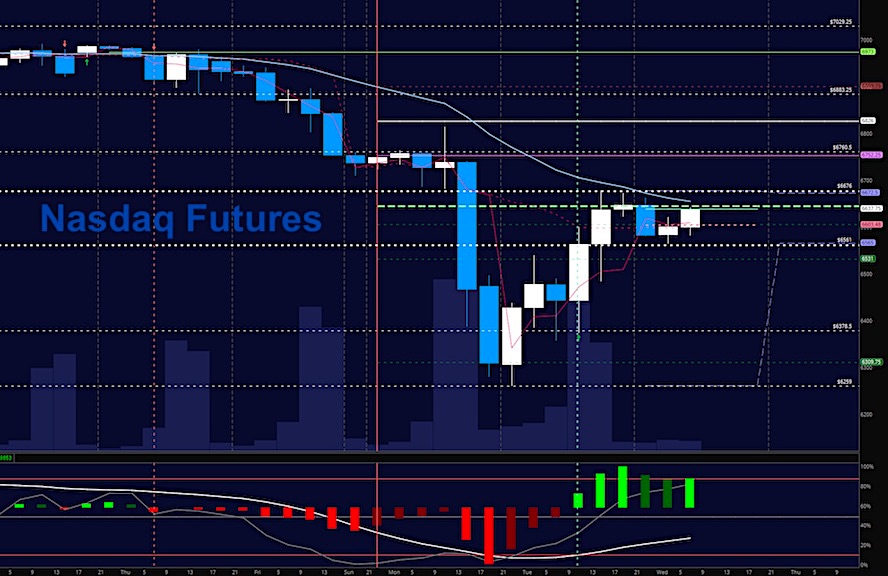
NASDAQ Futures
Momentum is mixed as traders try to continue the bounce off yesterday’s lows. Buyers now have to either hold higher support near 6378 or breach and hold regions above 6676 to continue the recovery in the charts. The bullets below represent the likely shift of intraday trading momentum at the positive or failed tests at the levels noted.
- Buying pressure intraday will likely strengthen with a positive retest of 6676.5
- Selling pressure intraday will likely strengthen with a failed retest of 6561
- Resistance sits near 6653 to 6732.25 with 6760.5 and 6880.5 above that.
- Support sits between 6565.25 and 6485.5, with 6378.75 and 6259.25 below that.
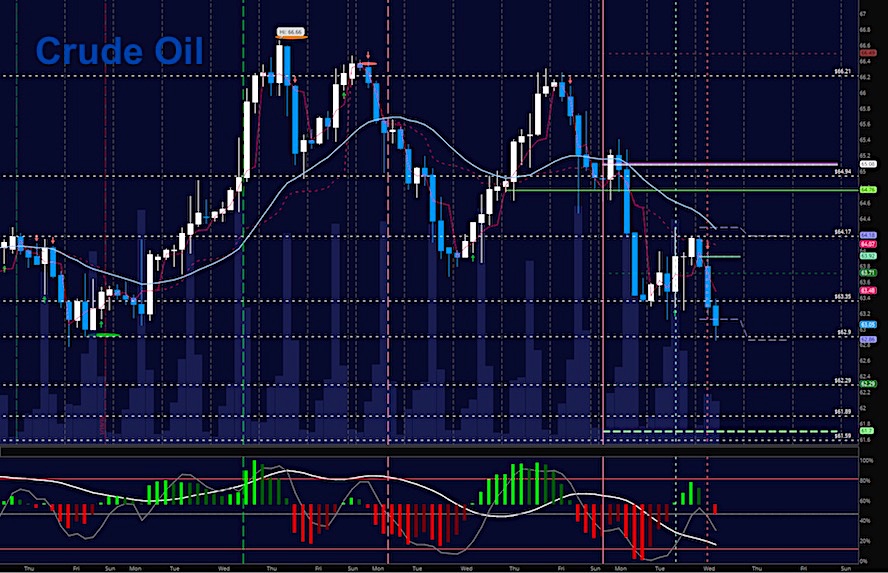
WTI Crude Oil
EIA report today. Traders fell into lower lows again this morning before bouncing at congestion near 62.86. I suspect a steady drift down into older support zones as this contract ages, but if we hold 62.9 we have a clear playing region all the way to 64.2. Trading remains choppy with momentum still drifting lower into edges that could retest the 60 level. The bullets below represent the likely shift of intraday trading momentum at the positive or failed tests at the levels noted.
- Buying pressure intraday will likely strengthen with a positive retest of 64.4
- Selling pressure intraday will strengthen with a failed retest of 62.8
- Resistance sits near 63.83 to 64.04, with 64.74 and 65.2 above that.
- Support holds near 62.9 to 62.6, with 62.2 and 61.9 below that.
If you’re interested in the live trading room, it is now primarily stock market futures content, though we do track heavily traded stocks and their likely daily trajectories as well – we begin at 9am with a morning report and likely chart movements along with trade setups for the day.
As long as the trader keeps himself aware of support and resistance levels, risk can be very adequately managed to play in either direction as bottom picking remains a behavior pattern that is developing with value buyers and speculative traders.
Twitter: @AnneMarieTrades
The author trades stock market futures every day and may have a position in mentioned securities at the time of publication. Any opinions expressed herein are solely those of the author, and do not in any way represent the views or opinions of any other person or entity.


