Broad Stock Market Outlook for February 28, 2018
Watching support becomes critical when price expands as it did rapidly in days past. And even more important when we see a swift reversal like yesterday.
As a result, we will keep our eyes focused on “higher” support to hold (in an uptrend we want a higher low to form). When it fails, it should quickly recapture its levels or we will push further down. Pullbacks still remain as buy zones in these formations but we are watching our support levels.
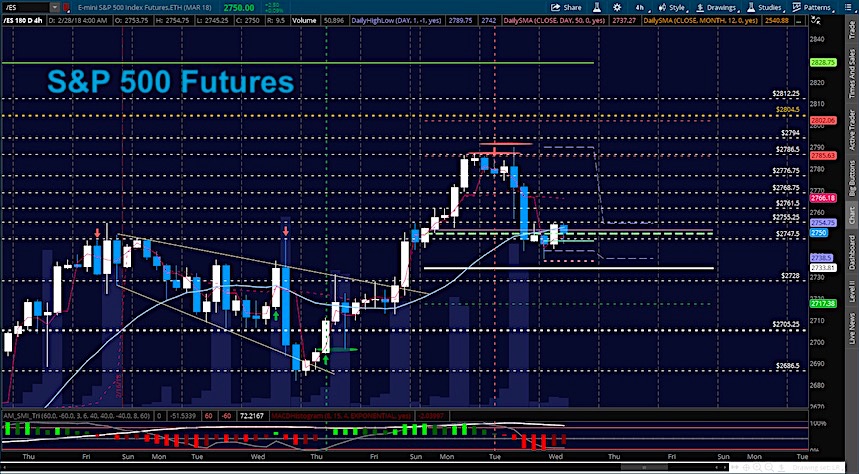
S&P 500 Futures
Support holds at 2738 for now. Failure to break and hold above 2768 (yesterday’s primary support) will present more downside possible. The bullets below represent the likely shift of trading momentum at the positive or failed retests at the levels noted.
- Buying pressure intraday will likely strengthen with a positive retest of 2757.5
- Selling pressure intraday will likely strengthen with a failed retest of 2736.5
- Resistance sits near 2755.75 to 2768.5, with 2776.5 and 2804.5 above that.
- Support sits between 2736.5 and 2724.5, with 2719.25 and 2704.5 below that.
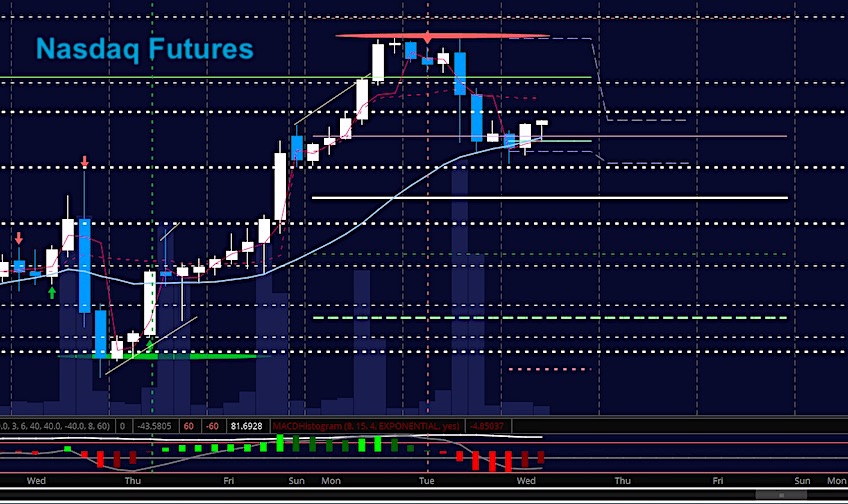
NASDAQ Futures
Deep dips in this chart held above 6889 – a breakout region of interest. Buyers will need to take us back above 6957 to resume control or we run the risk of deeper dips. Watch support zones. The bullets below represent the likely shift of intraday trading momentum at the positive or failed tests at the levels noted.
- Buying pressure intraday will likely strengthen with a positive retest of 6946.5
- Selling pressure intraday will likely strengthen with a failed retest of 6885
- Resistance sits near 6941.75 to 6956.5 with 6986.5 and 7009.5 above that.
- Support sits between 6904.5 and 6894.5, with 6861.5 and 6837.5 below that.
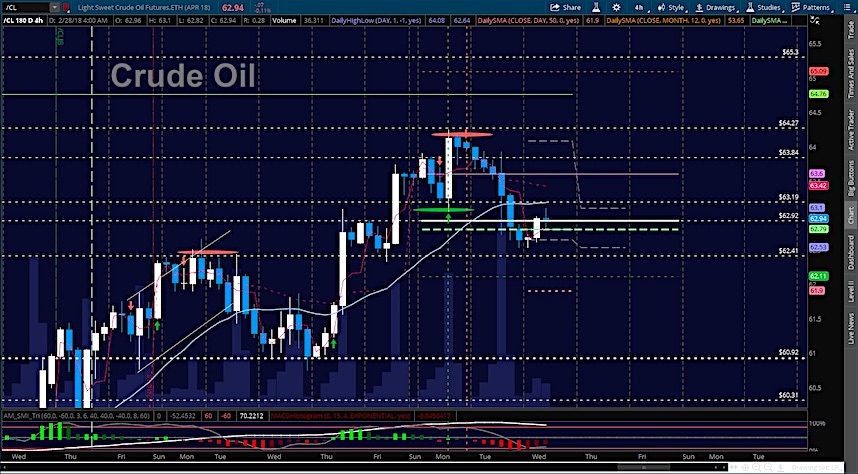
WTI Crude Oil
EIA at 10:30am ET. Jagged trading continues in this chart as we faded into support after solid bounces. Level to level trading seems like the best bet here as rhythm shows a wide risk event if participating in a trend bet. The bullets below represent the likely shift of intraday trading momentum at the positive or failed tests at the levels noted.
- Buying pressure intraday will likely strengthen with a positive retest of 63.65
- Selling pressure intraday will strengthen with a failed retest of 62.4
- Resistance sits near 63.3 to 63.65, with 64.04 and 64.87 above that.
- Support holds near 62.8 to 62.41, with 62.11 and 61.89 below that.
Twitter: @AnneMarieTrades
The author trades stock market futures every day and may have a position in mentioned securities at the time of publication. Any opinions expressed herein are solely those of the author, and do not in any way represent the views or opinions of any other person or entity.


 Testing Important Price Support")


