We begin the second week of April in congestion territory with ranges between 2032.5 and 2053.75. This morning stock market futures are attempting to push higher but are meeting resistance.
The tests of the two levels mentioned above will be important to gauge further extensions in price, either long or short. S&P 500 futures are range bound with mixed momentum, and that means levels will be tested several times before resolution.
Stock market futures levels to watch are S&P 2054 as initial resistance and 2033 as initial support. I expect sellers will attempt to hold us from advancing through 2054, but the positive retest there could give us 2061.5. On the flip side the failed retest of 2033 could give us 2023 and perhaps even 2018.75.
Momentum on the four hour chart is still neutral to negative; we are sitting at congestion as I mentioned. Buyers continue to save the day with deep traces south, but sellers continue to prevent price advances to the north.
Shorter time frame momentum indicators are neutral to positive as we sit in congestion here at 2048- almost the same area as Thursday and Friday of last week at this time of morning.
See today’s economic calendar with a rundown of releases.
THE RANGE OF THURSDAY’S MOTION
Crude Oil Futures (CL_F)
As the OPEC meeting looms ahead, crude oil futures continue to bounce in anticipation of a positive outcome. Crude oil hit a familiar resistance zone overnight but it seems likely under the positive pressure that buyers will try to bring us to a retest of this level near 40.47. The support zone near 39-39.23 is holding steady. A failed retest should bring us back to 38.4 – 38.15
Today, the trading ranges for crude oil futures are potentially wider as expansion in either direction is likely – 38.12 -41.2
Moving averages in oil are still mixed on tighter time frames, but grinding higher in general. With bullish action still prevailing, we expect bounces near the edges of support on pullbacks and only failed retests (where old support becomes new resistance) will likely give us downside continuation.
Intraday long trading setups for crude oil suggest a long off a 39.76 positive retest (check momentum here), or 39.23 positive retest on the pullback into targets of 39.56, 39.74, 39.9, 40.15, 40.54, and if buyers hold on, we’ll see 40.8 to 41.3.
Intraday short trading setups suggest a short below a 39.56 failed retest, or the failed retest of 40.11 (with negative momentum prevailing) sends us back through targets at 39.34, 38.9, 38.4, 38.17, 37.94, 37.68, and 37.2 to 36.87, if sellers hang on.
E-mini S&P 500 Futures (ES_F)
Below is a S&P 500 futures chart with price support and resistance trading levels for today. Click to enlarge.
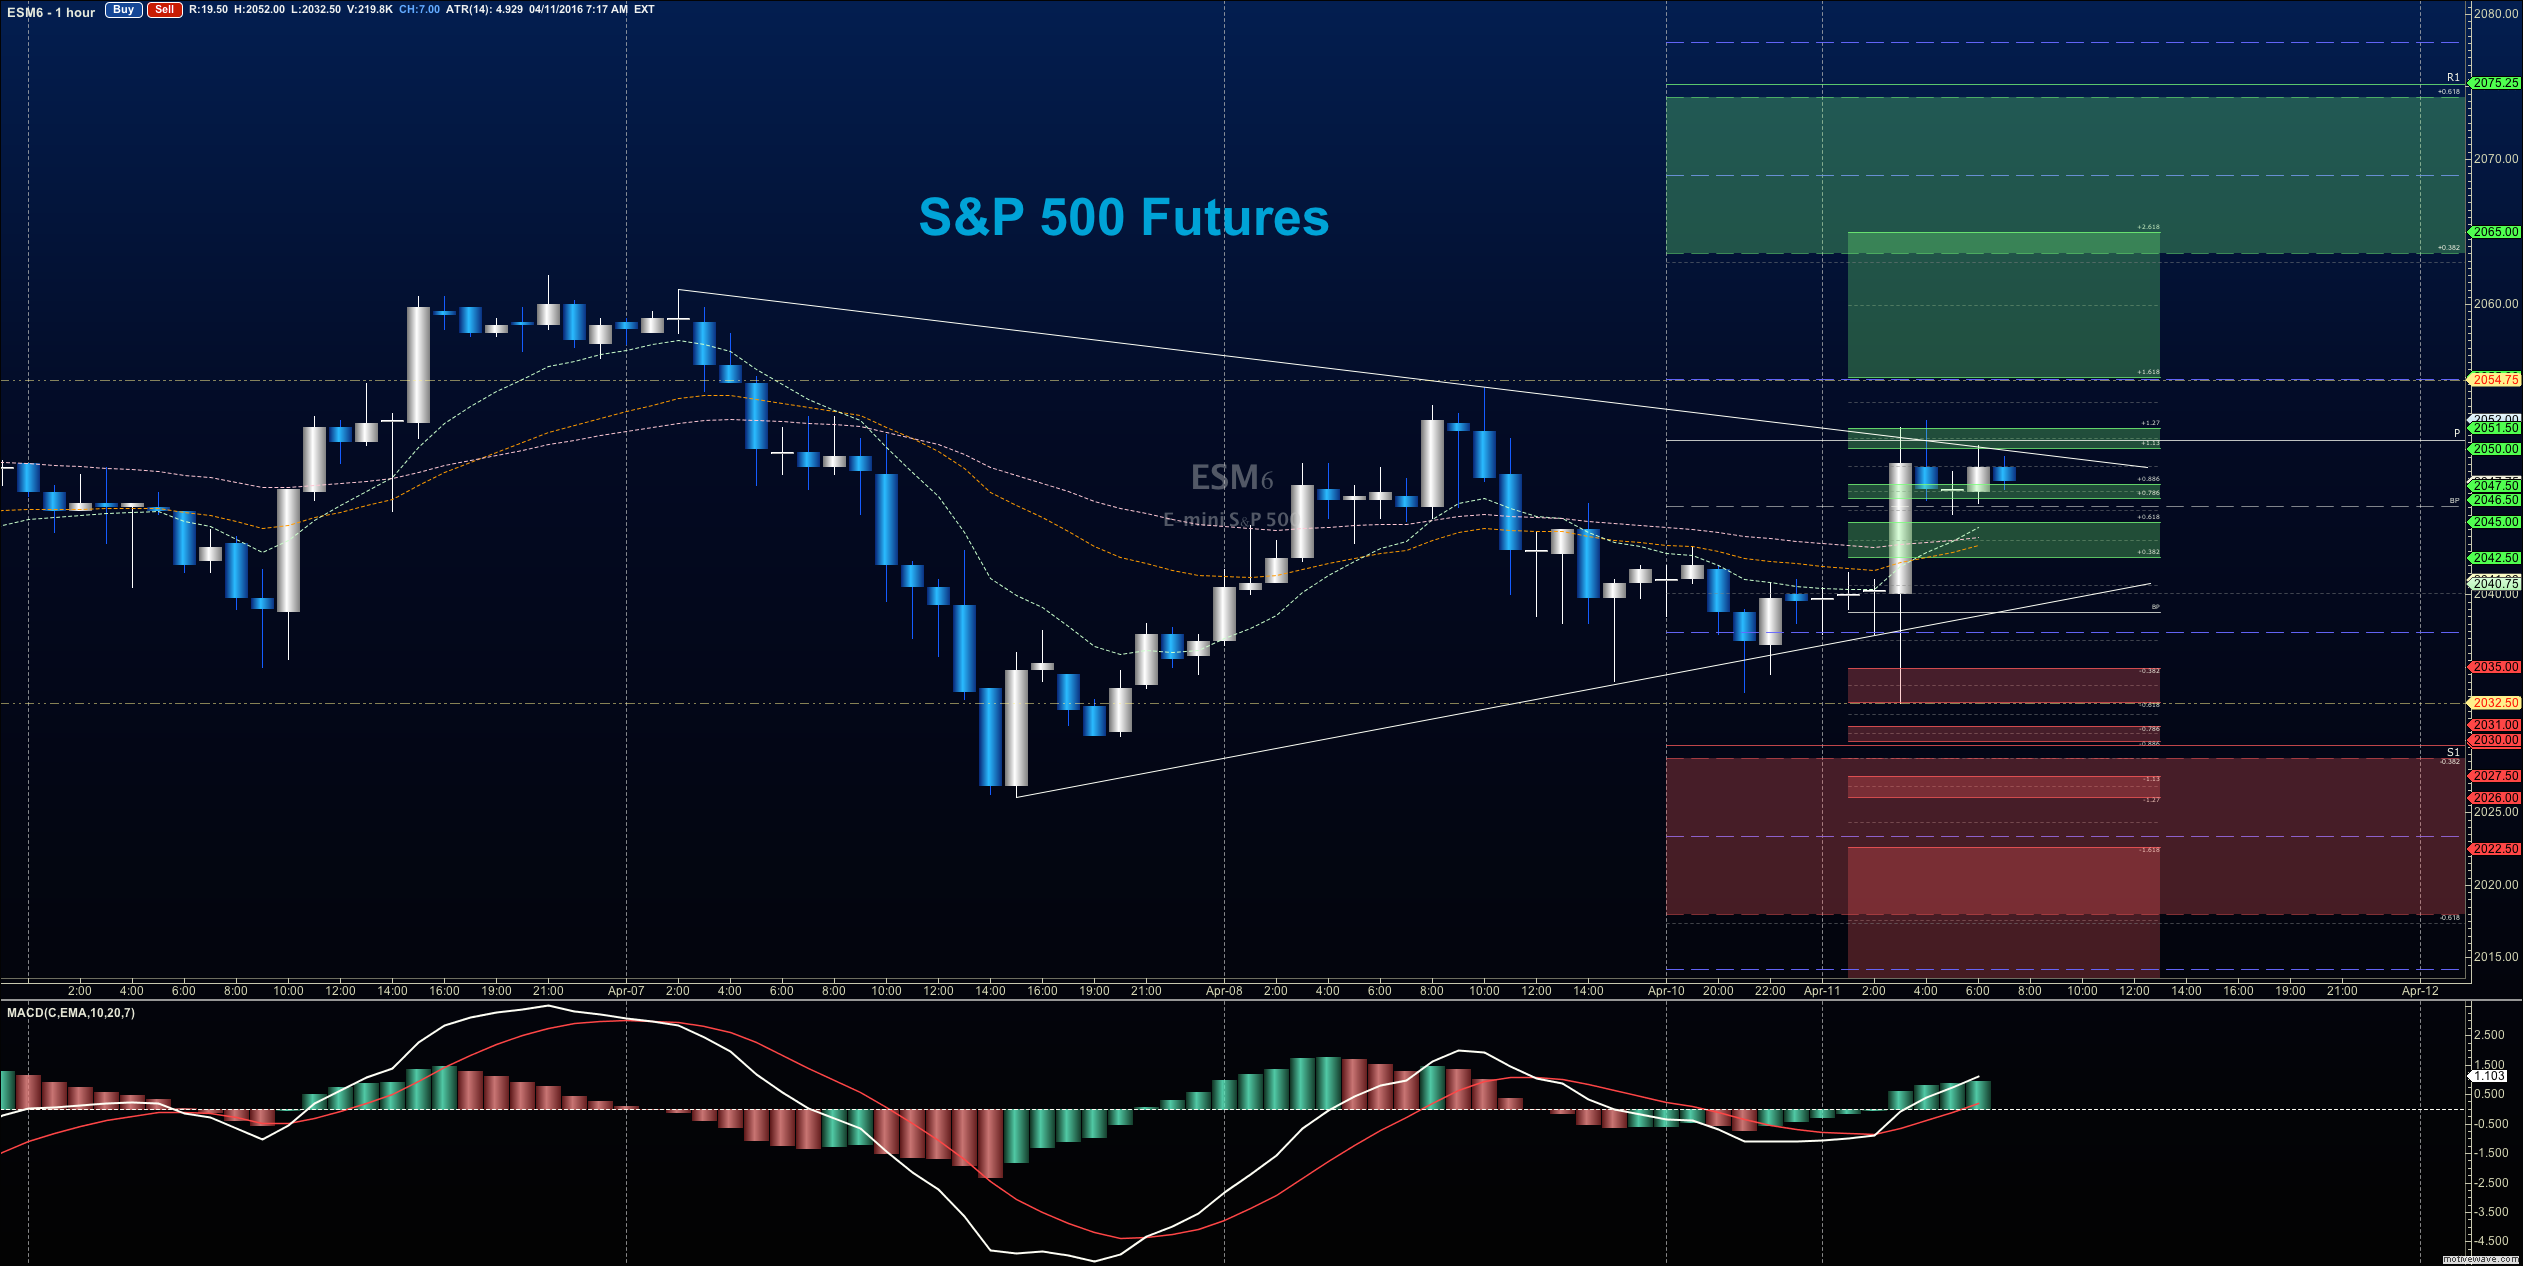
S&P 500 futures levels between 2054- 2061.5 serve as front line resistance – if buyers take hold we could easily see 2071.5 to 2076. Front line support sits near 2032.5- 2023.5 region. Below there, we could see 2012 – 2007 if sellers try to storm support near 2025. It seems likely that the edges should produce reversal action, particularly at the first pass.
Upside motion has the best setup on the positive retest of 2041.5 or a breach and retest of 2053.5 with positive momentum. I use the 30min to 1hr chart for the breach and retest mechanic. Targets from 2041.5 are 2044.5, 2047.5, 2049.5, 2051.25, 2054.5, 2057.5, and if we can catch a bid there, we could expand into 2061.5, 2064.25, and 2067.5. Long action is still trending over the bigger picture for now, but momentum is still drifting.
Downside motion opens below the failed retest of 2038.5 or at the failed retest of 2053.5 with negative divergence (careful here- watch for the higher low to develop to tell you that an early exit might be necessary). Retracement into lower levels from 2053.5 gives us the targets 2049.5, 2047.75, 2044.75, 2040.50, 2038.5, 2035.75, 2032.75, 2029.5, and perhaps 2026.5 to 2023.5. Buyers should still come to the rescue at the deep support, particularly at the first pass.
If you’re interested in the live trading room, it is now primarily stock market futures content, though we do track heavily traded stocks and their likely daily trajectories as well – we begin at 9am with a morning report and likely chart movements along with trade setups for the day.
As long as traders remain aware of support and resistance levels, risk can be very adequately managed to play in either direction as bottom picking remains a behavior pattern that is developing with value buyers and speculative traders.
Thanks for reading.
Twitter: @AnneMarieTrades
The author trades stock market futures every day and may have a position in mentioned securities at the time of publication. Any opinions expressed herein are solely those of the author, and do not in any way represent the views or opinions of any other person or entity.


