MARKET COMMENTARY
World central banks adjust their interest rates to fall in line with the US and traders hold the floor of support from the selloff a couple of days ago.
Traders are trading support to resistance patterns and algorithms are helping them do just that in the current jumpy market where alpha searching abounds.
Negative macro voices continue louder so bounces into prior higher congestion should fail.
Gold spiked, bitcoin spiked but both of these very interesting instruments are under extreme divergence and are likely to give way under the weight of price chasing.
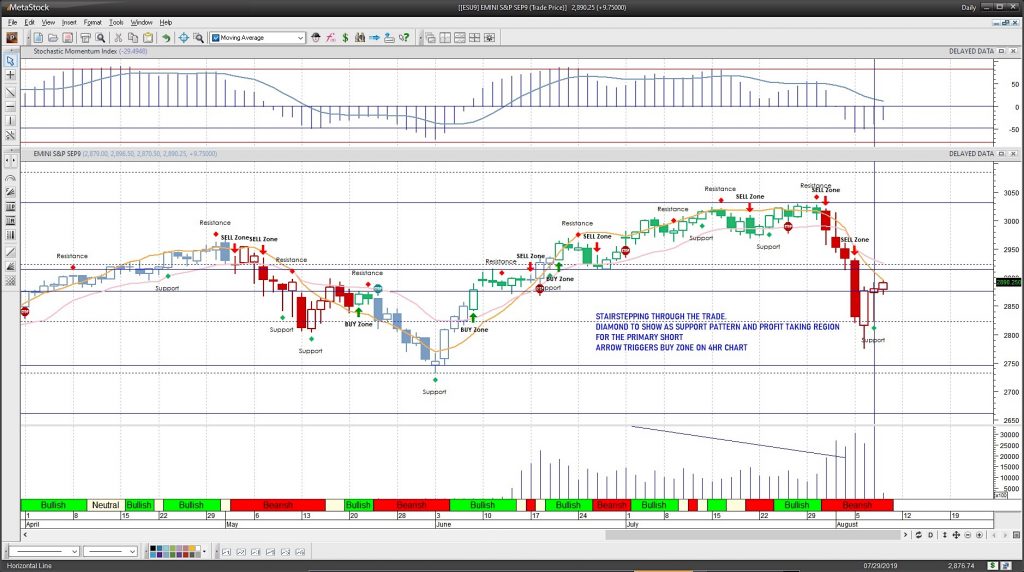
Let’s look at the S&P 500 futures chart.
PRICE ACTION
The e-mini S&P held its bounce after another fade into the close of the day prior before bouncing. We are continuing the stairstep back up to 2912. This 2912 level is very important, breaching it will really bring buyers back in full force.
The mini Nasdaq is battling with 7557 as higher support and the recovery of 7840 will give us a relative reversal and send us back to bullish motion. The mini DOW traders can’t seem to get us over 26080 and until we do, that remains a warning signal. Fast moves are the order of the day and that will make for failed moves, by and large. Watch your edges.
COMMODITY & CURRENCY WATCH
Gold is still under technical divergence near 1505 support. Trading here should be with smaller size as the smaller pullback could still break with the technical divergence even as it rises higher.
Currency moves continue at the forefront of the markets this week and over the coming months. The USD index now holds very familiar channel support near 97.3 to 97.5. WTI collapsed with vigor into the lows near June and now struggles at 52. A failure of 51.7 once more would very likely get us right back into deep support near 50.4.
INTRADAY RECAP
Cross currents as we struggle at resistance levels near 2881-2887. The levels and range between 2871 to 2912 is the watch data for the e-mini S&P today. The mini Nasdaq is battling the range between 7508 to 7667.
The mini DOW is battling resistance near 26087 but recovery could see 26288. Continue to be careful here on the edges of your charts as we could accelerate out and continue if traders get too heavy on the edges, in which case, you’ll have to reverse your position.
OVERALL WIDE ANGLE
Remains the same. Divergent action still sits below the movement of price on both sides of the trades – long and short – but traders are still looking at deep support edges to bounce. They are currently failing in this endeavor as we search for stabilizing support below.
Twitter: @AnneMarieTrades
The author trades stock market futures every day and may have a position in mentioned securities at the time of publication. Any opinions expressed herein are solely those of the author, and do not in any way represent the views or opinions of any other person or entity.

 Flirting With Critical Support… Again")


