MARKET COMMENTARY
Deep support on the S&P 500 Index INDEXSP: .INX is being tested and it matters a lot. Many traders are looking for 2820 to hold but if it does not, we will certainly have a likelihood of fading into 2794 and possibly 2769.
This is confirming the cyclical and seasonal downdrafts that we see in August and September.
The takeaway?
Profit taking continues on the bounces. Stock pickers continue to excel with selective stocks performing in spite of the backdrop – caution required across the board, though. So don’t chase highs and let allow bounces to retest breakouts before engaging in longs.
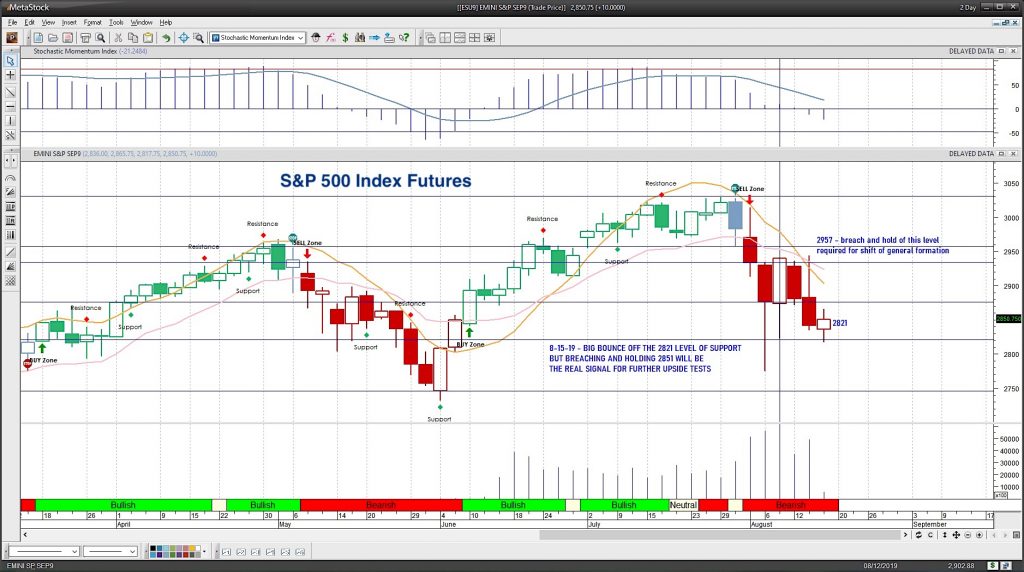
PRICE ACTION
The e-mini S&P 500, though off its highs, is holding well below 2900. The mini Nasdaq is battling 7457, a support region of importance. The mini DOW traders have us above 25076 but like the others, sit under the weight of buyers looking for a way out.
COMMODITY & CURRENCY WATCH
Gold broke resistance, and is once again in clear breakout territory. Pullbacks remain buy zones. Currency moves continue at the forefront of the markets for another week and over the coming months. The USD index now holds 97.7 -above the familiar channel support near 97.3 to 97.5 remaining resilient in its upward path. WTI is collapsing after a draw in inventories and is moving towards that 52 region. Holding 52 remains the floor in the near term.
INTRADAY RECAP
Ranges widen and as traders continue selling, we hold levels between 2801 and 2851. The mini Nasdaq is battling in the range between 7408 to 7667. The mini DOW is holding support near 25008 with resistance sitting near 25689. Continue to be careful here on the edges of your charts as we could accelerate out and continue if traders get too heavy on the edges, in which case, you’ll have to reverse your position. Markets feel quite bearish – which may lead to a tipping point and a reversal so use caution with size.
OVERALL WIDE ANGLE
Negative price action heads up near deep supports – but traders are still looking at deep support edges to bounce – see the weekly charts for this confirmation. Weekly charts are showing flattening momentum and some more downside weakness that that must be confirmed.
Twitter: @AnneMarieTrades
The author trades stock market futures every day and may have a position in mentioned securities at the time of publication. Any opinions expressed herein are solely those of the author, and do not in any way represent the views or opinions of any other person or entity.
: Creating Bullish Divergence?")

 and Semiconductors (SMH): Concerning Price Pattern?")


: Creating Bullish Divergence?")