The outlook for stock market futures for February 25 highlights how S&P 500 futures has actually been landlocked for the last seven days. Sure, there’s been rallies and selloffs, but traders are waiting for major support/resistance to break.
The Morning Report: Important Price Action Here
Momentum on stock market futures is mixed, but positive on these time frames (so the weight of its power is hidden). Prior visits here have resulted in rejection back to 1914 and perhaps 1908. However, a breach and hold over 1941.5 on S&P 500 futures will expand us into 1946, but a successful retest of the breach level will help clear the way for more upside. 1952-1954 presents as congestion and 1962.5-1964 lie as targets to the north.
Momentum on the four hour chart is sloping positive, but sitting in negative territory – that’s pointing to a test of resistance likely to fail at first pass. The daily charts of S&P 500 futures read momentum as trending mildly positive, and in neutral territory – suggesting failures into support levels will bring buyers to the rescue once again.
Shorter time frame momentum indicators are sitting in positive territory, and sloping up. Positive divergence is holding in longer time frames for now but still suggest price action that will be jagged.
See today’s economic calendar with a rundown of releases.
THE RANGE OF TUESDAY’S MOTION
Crude Oil Futures (CL_F)
Crude oil futures buyers show increased strength and are trying to force this chart north. The range between 31.7 and 32.2 is being heavily contested. Momentum is mixed, so range based trading becomes powerful again.
Today, the trading range on crude oil futures is between 31.17 and 32.8. Price expansions outside those zones will retest, and if held will advance in the direction of the break. Battleground particularly fierce in the 31.9 region.
Moving averages in oil are still mixed across longer intraday time frames across the board-daily and weekly charts still show primarily negative trend. Moving average squeezes are present across a number of time frames. Four hour time frames show moving averages up to flat, with little momentum propelling motion in either direction.
Intraday long trading setups on crude oil futures suggest a long off 31.94 positive retest, or 31.63 bounce into 31.86, 32.2, 32.46, 32.78 and if buyers hold on, we’ll see 33.12 to potentially 33.73.
Intraday short trading setups suggests a short below a 31.8 failed retest, or off the big bounce into 33.2 (but will be watching divergence and the higher low to take me out of this trade) sends us to 31.62, 31.2, 30.78, 30.36, 30.11, and if sellers get a real foot hold 29.74 to 29.46.
Have a look at the fibonacci levels marked in the blog for more targets.
E-mini S&P 500 Futures (ES_F)
Below is a S&P 500 futures chart with price support and resistance trading levels for today. Click to enlarge.
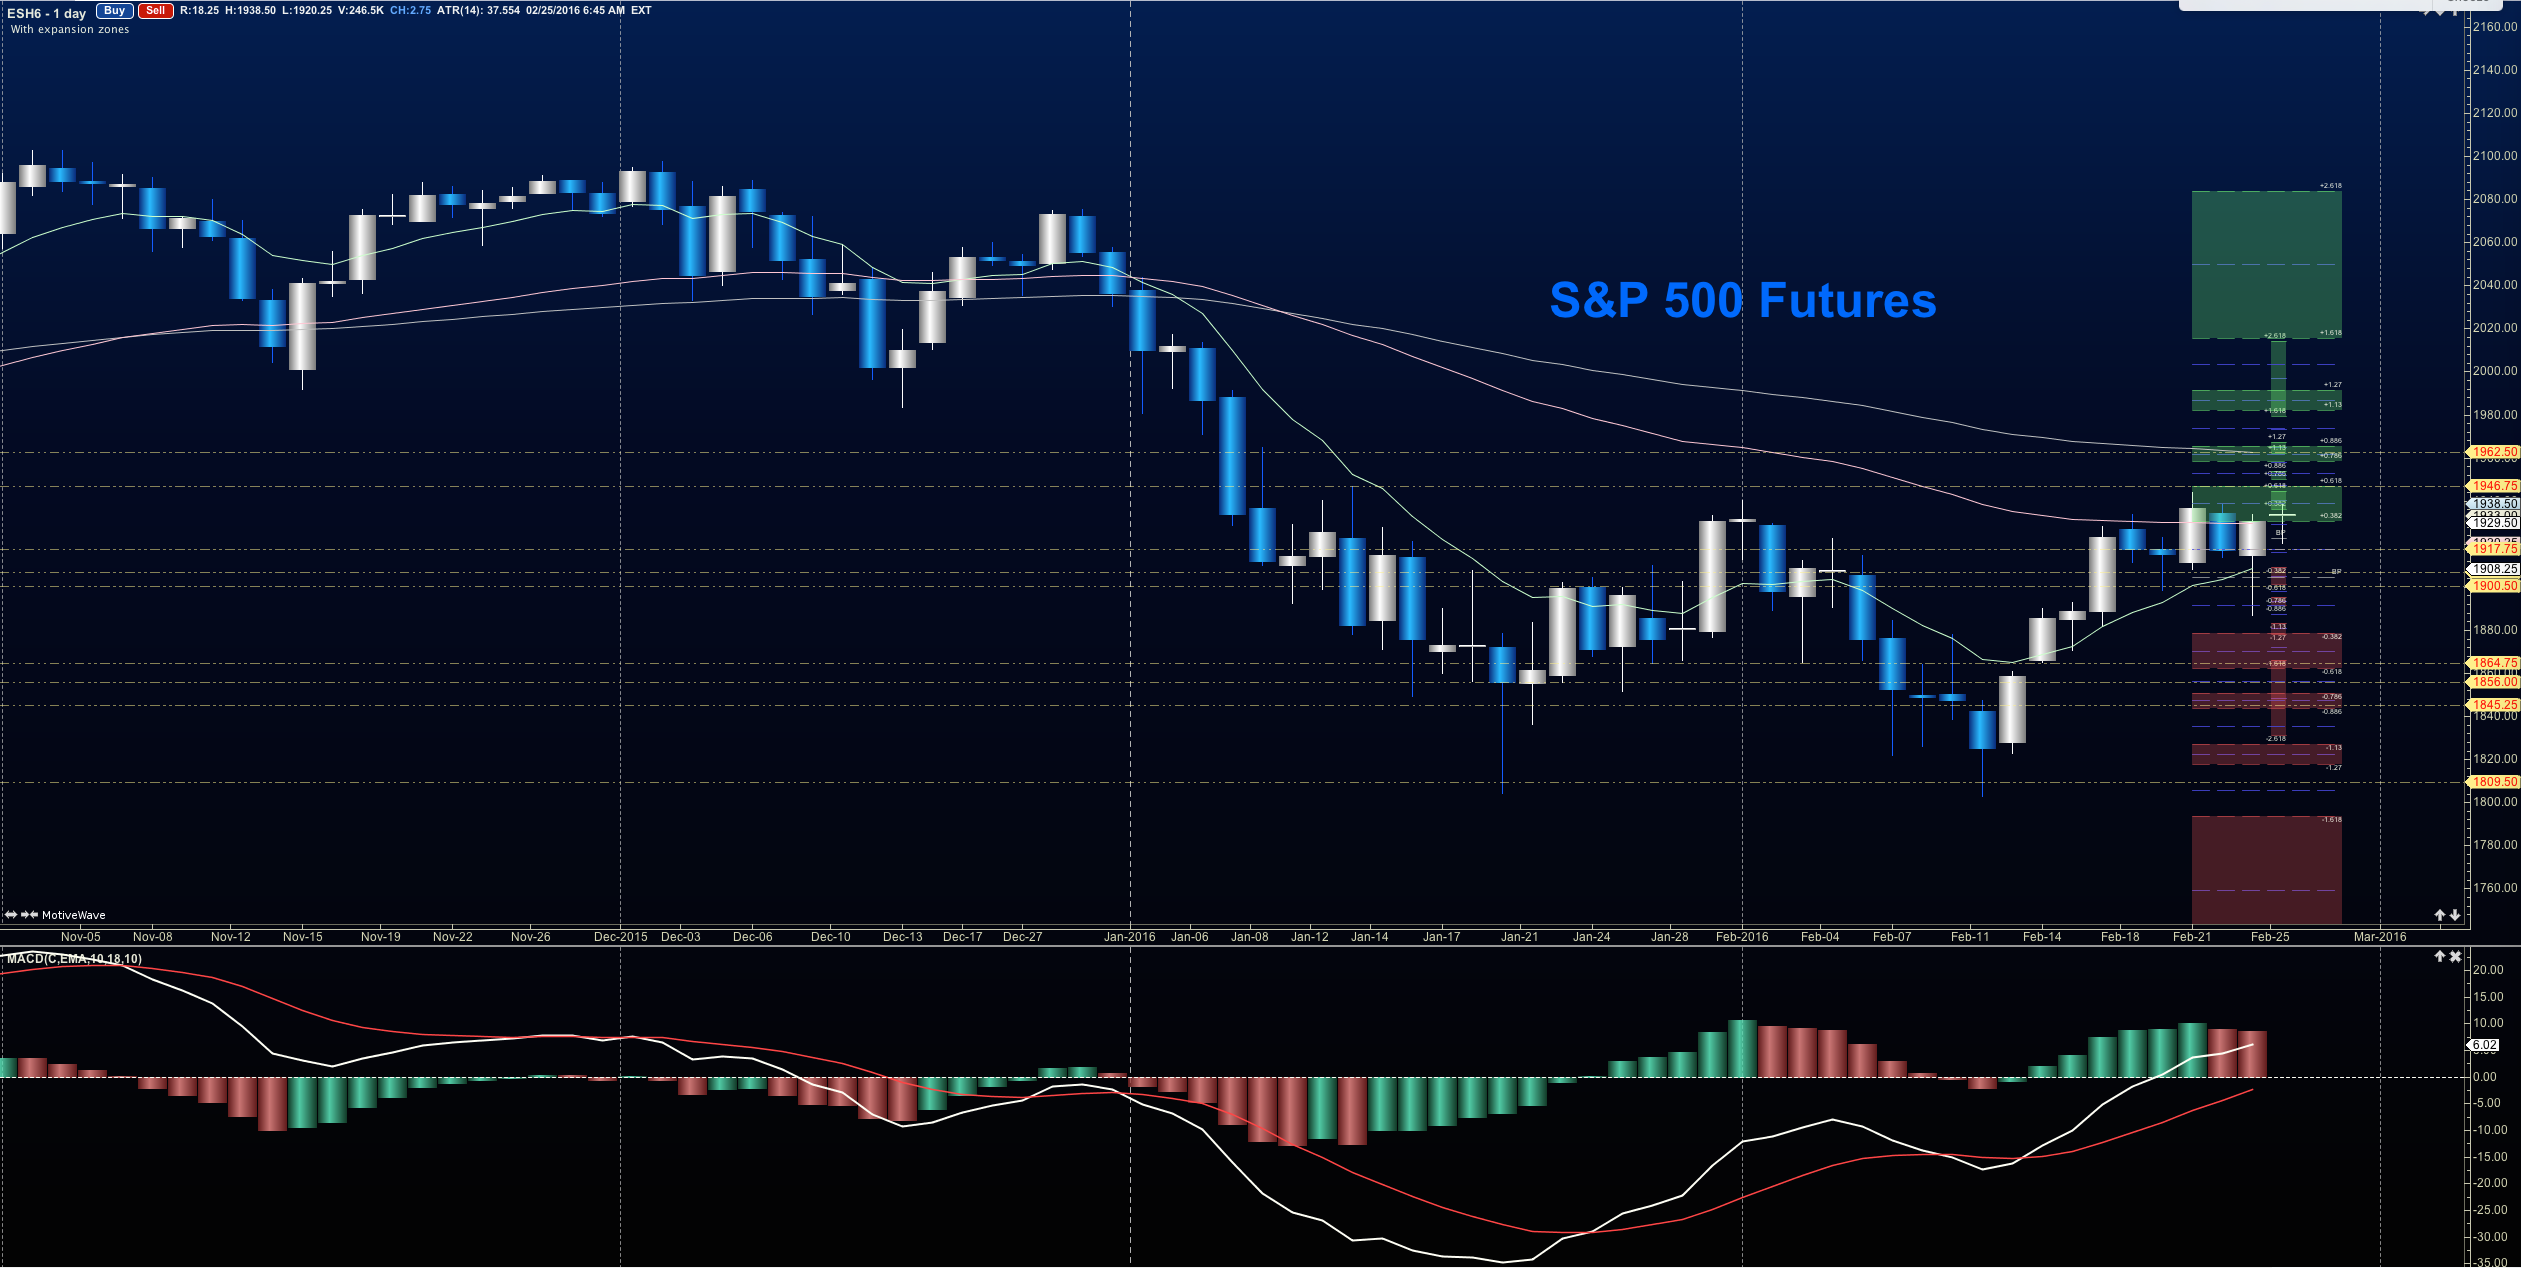
The outlook based on the S&P 500 futures chart shows important retests coming at 1936.5 and 1939.5. The latter level on stock market futures is a very important level for buyers to recapture.
Upside motion has the best setup on the positive retest of 1929.5 or a breach and successful retest of 1943.5. Targets from 1929.5 are 1933.5, 1936.75, 1941.25, 1943.5, 1946.25, 1950.5, and if we can catch a bid there, we could expand into 1954.5, 1961.25. Big resistance for S&P 500 futures sits at the region between 1964-1968. Watch the higher lows to keep you on the right side of the long trade. Charts are firming up but still appear undecided here-keep that long undercurrent in mind, as it still appears on the daily and weekly time frames.
Downside motion opens below the failed retest of 1928 or at the failed retest of 1942 with negative divergence. Retracement into lower levels from 1928 gives us the targets 1923.5, 1918.75, 1914.75, 1911.5, 1909 and perhaps 1900.75 if selling really takes hold. If buyers do not provide support there, we’ll see the also familiar 1888 – 1884 levels once more.
Have a look at the fib levels marked in the blog for more targets.
If you’re interested in the live trading room, it is now primarily futures content, though we do track heavily traded stocks and their likely daily trajectories as well – we begin at 9am with a morning report and likely chart movements along with trade setups for the day.
As long as traders remain aware of support and resistance levels, risk can be very adequately managed to play in either direction as bottom picking remains a behavior pattern that is developing with value buyers and speculative traders.
Twitter: @AnneMarieTrades
The author trades stock market futures every day and may have a position in mentioned securities at the time of publication. Any opinions expressed herein are solely those of the author, and do not in any way represent the views or opinions of any other person or entity.

 Flirting With Critical Support… Again")


