Wednesday morning is seeing mixed action across stock market futures after Tuesday’s big rally. Yesterday’s price action was unique in the near term as it did not retrace early morning gains. So that will be the big question for today’s stock market futures outlook.
The Morning Report: Range Expansion
Across the board, very few charts returned to fill their gaps. This represents a shift in market participants and gives the charts a bullish slant not seen in some time. 1984 on S&P 500 futures represents solid resistance but 1994 to 1998 lies above as an eager target for those bullish on stock market futures.
Momentum on the four hour chart is sloping positive but flattening, and in neutral territory – support tests are ahead for us- higher lows on the horizon. Daily charts read momentum as trending positive, and in positive territory.
Shorter time frame momentum indicators are sitting in positive territory, and sloping down. 1968 is the level to watch for sellers to test and for buyers to hold.
See today’s economic calendar with a rundown of releases.
THE RANGE OF TUESDAY’S MOTION
Crude Oil Futures (CL_F)
Oil-EIA Report – API shows 11 million barrels in build
Crude oil futures are trying to consolidate for another move. And buyers are trying to prop price up here irrespective of fundamental undercurrents.
Pullbacks show buyers at the ready to defend support. New support 33.5 – 33.71 – price pressure seems strong, but negative divergence is present. If the EIA number is smaller, it will result in the chart spiking upward again
Today, the trading ranges on crude oil futures are between 33.5 and 34.8. Expansions outside those zones will retest, and if held will advance in the direction of the break.
Moving averages for crude oil show us at a decision zone with increasing positive momentum. This generally gives rise to buyers showing up when it seems like the chart will roll. Charts have breached moving averages that have created areas of resistance that will now act as support and give buyers courage to advance price. The formation assessment mirrors yesterday’s.
Intraday long trading setups on crude oil futures suggest a long off 34.11 positive retest, or 33.74 bounce into 34.02, 32.26, 34.46, 34.78, 35.05 and if buyers hold on, we’ll see 35.35 to potentially 35.75.
Intraday short trading setups suggest a short below a 33.65 failed retest with negative divergence, or the failed retest of 34.4 sends us back through familiar targets to 34.14, 33.76, 33.45, 33.23, 32.87, 32.59, 32.35, 32.02
Have a look at the Fibonacci levels marked in the blog for more targets.
E-mini S&P 500 Futures (ES_F)
Below is a S&P 500 futures chart with price support and resistance trading levels for today. Click to enlarge.
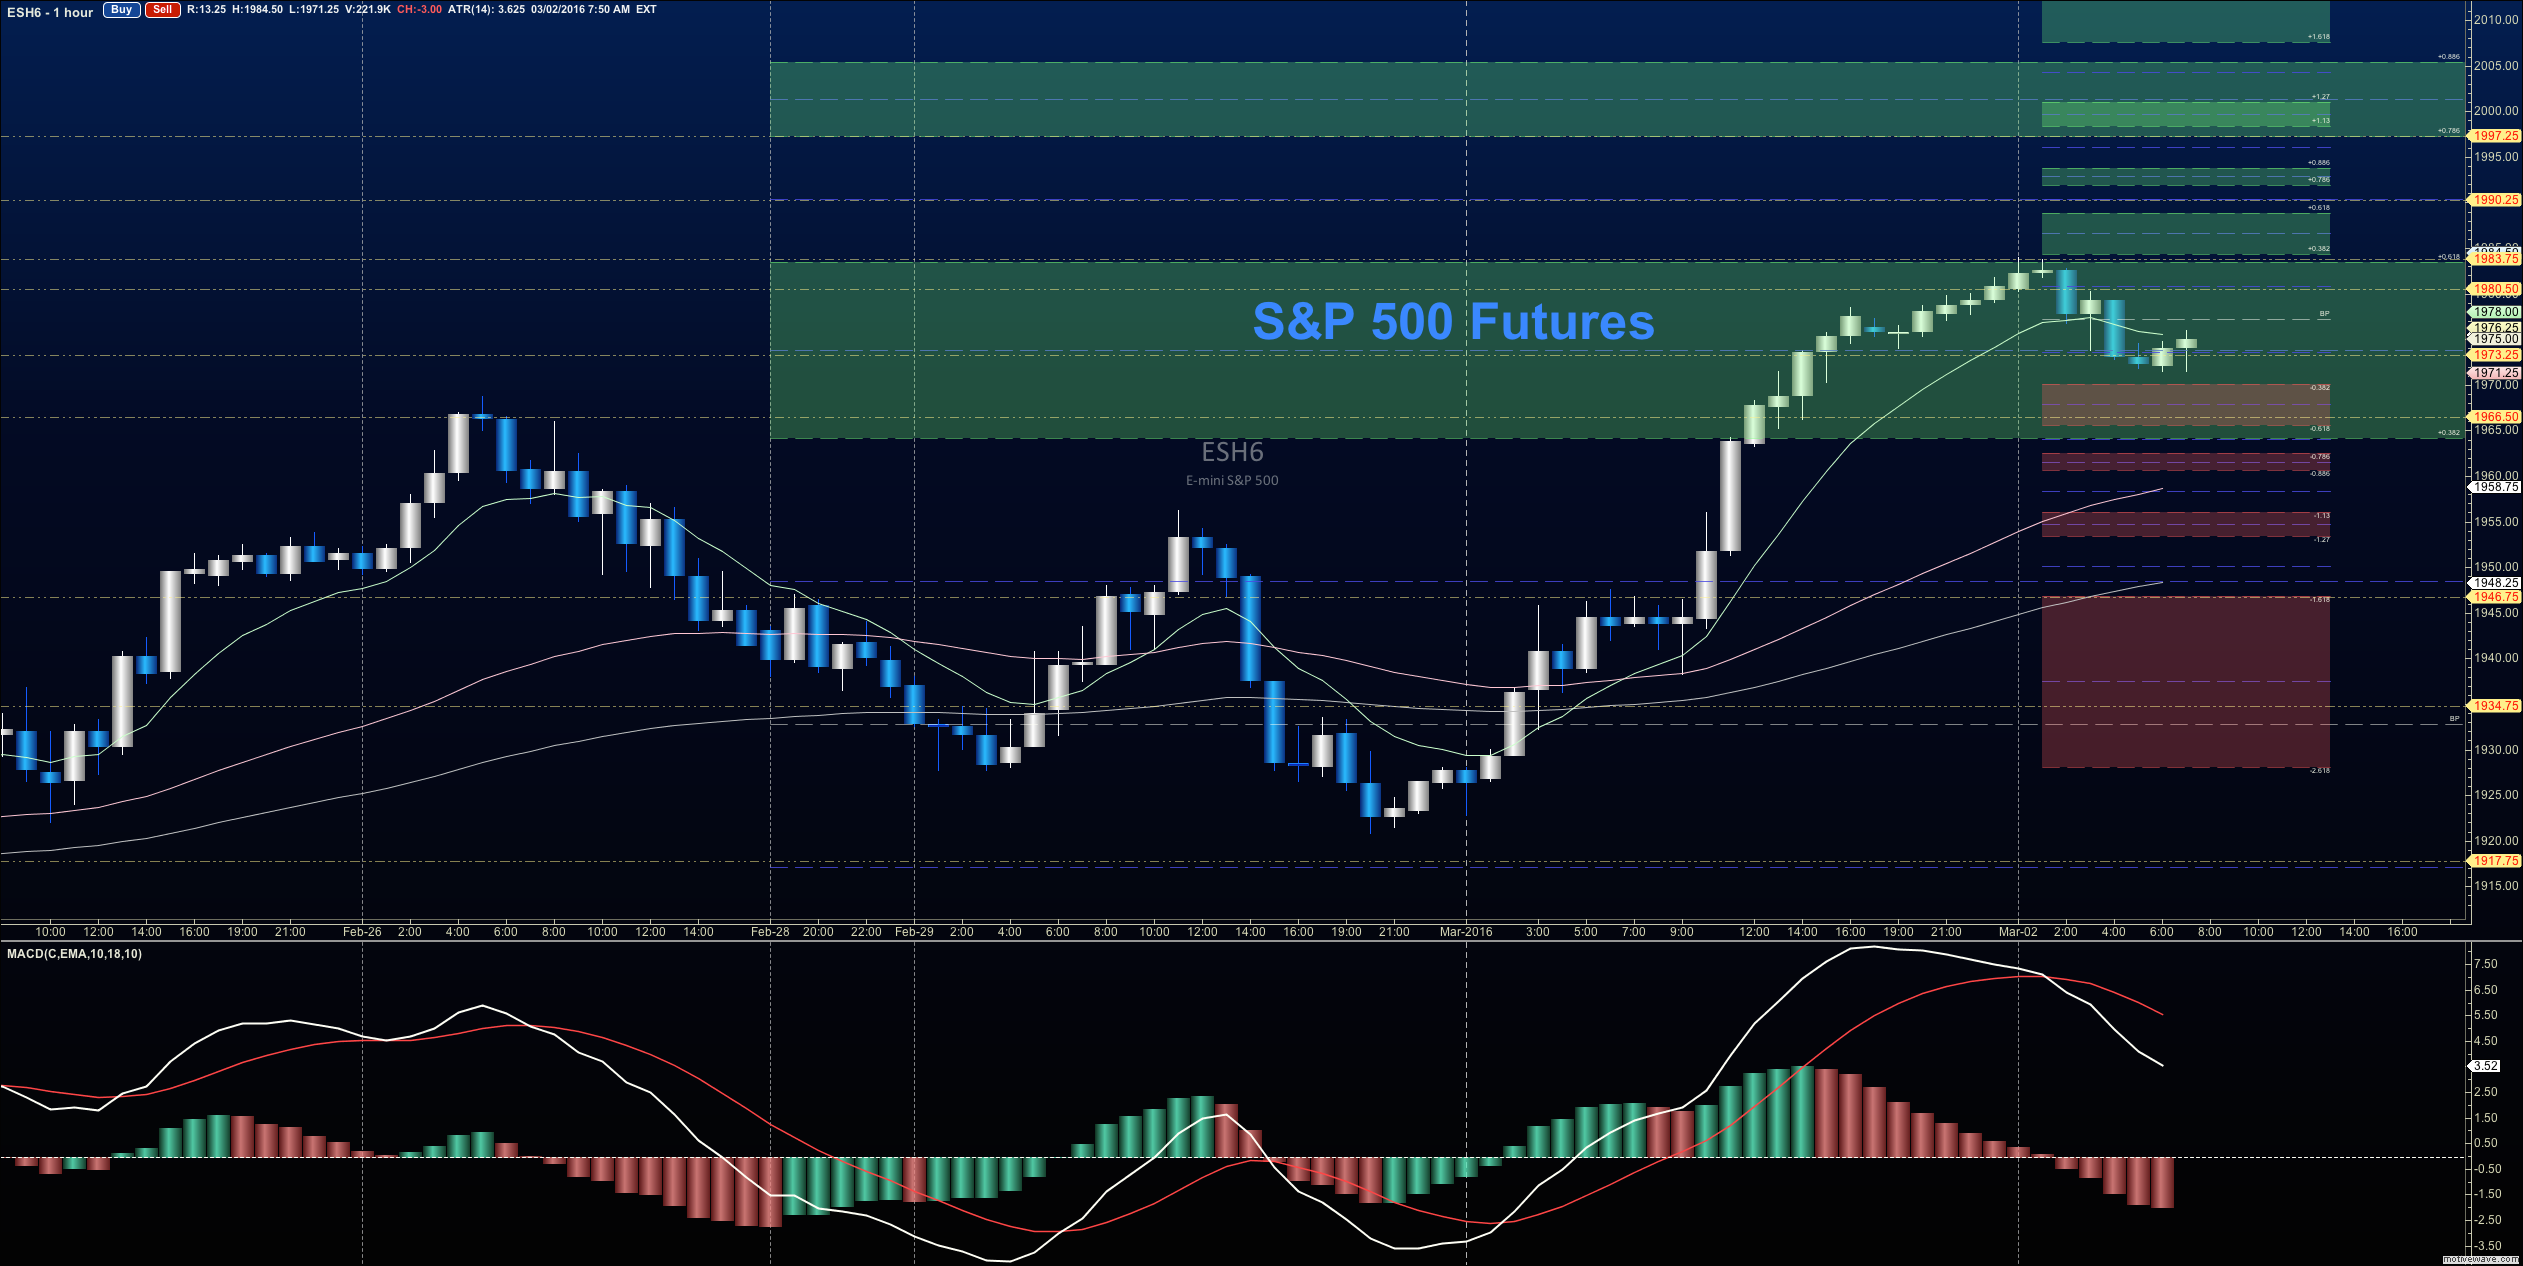
Okay, looking at the March 2nd stock market futures outlook for the S&P 500, we see a big rally that has expanded the range. Pullbacks yesterday were shallow as buyers assumed control. We are receding from the 1984 levels of resistance seen late last year. 1971-1974 remains a congested zone and will provide support for now.
Upside motion for S&P 500 futures has the best setup on the positive retest of 1968.75 or a breach and successful retest of 1977.75. I use the 30min to 1hr chart for the breach and retest mechanic. Price targets from 1968.75 are 1964.5, 1971.5, 1974.25, 1977.5, 1981.5, 1984.5, 1989, 1993.25, and if we can catch a bid there, we could expand into 1995.5 – 1998.75 and beyond. The next big resistance test sits at the region between 1996- 2011. Watch for higher lows across stock market futures to keep you on the right side of the long trade. Charts are firming up, but expect pullbacks into higher support. The more shallow they are, the more likely the chart is to rise.
Downside motion opens below the failed retest of 1968.5 or at the failed retest of 1984.5 with negative divergence – but really watch for the higher lows there to tell you the short is ill positioned. Retracement into lower levels from 1968.5 gives us the targets 1964.5, 1961, 1956.75, 1948.5, 1944.5, 1937.75, and perhaps 1921.5 if selling really takes hold.
If you’re interested in the live trading room, it is now primarily stock market futures content, though we do track heavily traded stocks and their likely daily trajectories as well – we begin at 9am with a morning report and likely chart movements along with trade setups for the day.
As long as traders remain aware of support and resistance levels, risk can be very adequately managed to play in either direction as bottom picking remains a behavior pattern that is developing with value buyers and speculative traders.
Twitter: @AnneMarieTrades
The author trades stock market futures every day and may have a position in mentioned securities at the time of publication. Any opinions expressed herein are solely those of the author, and do not in any way represent the views or opinions of any other person or entity.


