This will be the only daily market update for this week.
As such, two key areas are in focus and both reliable in determining the next moves in the stock market.
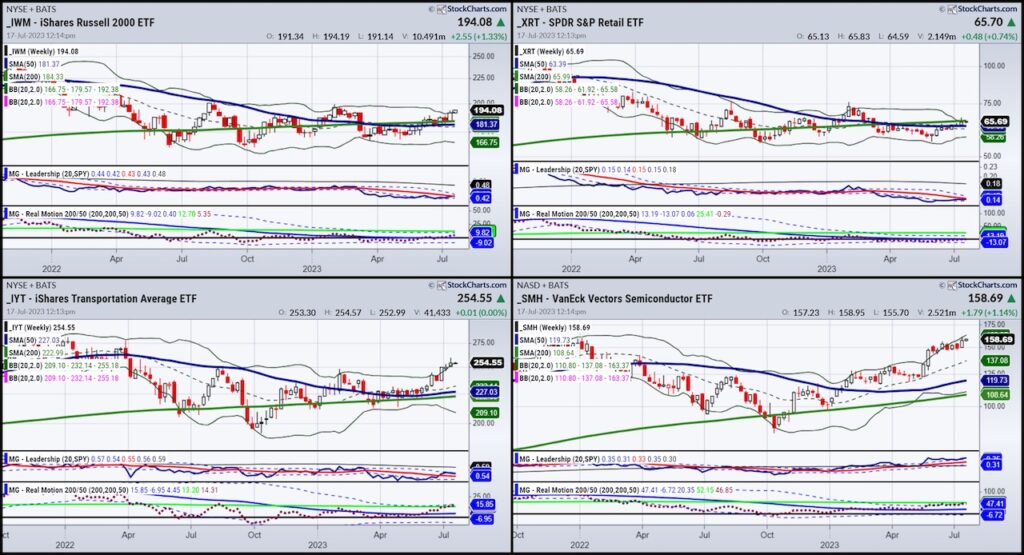
First, we have the charts of the Economic Modern Family of ETFs (Russell 2000, Retail, Transportation, Biotech, Semiconductors, Regional Banks – we will leave Bitcoin out for now).
Secondly, we have the re-set of the 6-month July calendar range.
If we put both together, you will see how well aligned the price charts and the calendar range indicators are.
Of course, the rates, dollar, earnings, gold, oil, food, climate are all factors as well.
However, we want to leave you with a blueprint that is simple and can help you navigate where to put your money right now.
The first 4 charts are all in a weekly timeframe as per our book Plant Your Money Tree.
The Russell 200 IWM is in an Accumulation Phase. The Leadership is on par with the benchmark. Real motion momentum is in a bearish divergence.
Verdict-Monday’s high will be the top of the calendar range. A move over 195 hard to argue with. A break under 190 suspect.
Retail XRT is in a Distribution phase and has to clear the 200-WMA and calendar range high at 67.42. A move under 63.40 would be weak. It is underperforming SPY and has a bearish divergence in momentum.
Transportation IYT is in a bullish phase. Last week it made its July Calendar range high. IYT outperforms SPY and momentum is weak compared to price. 245 is the key area to hold.
Semiconductors SMH has its July range high at 160.70. In a bullish phase, SMH has outperformed SPY since April. Momentum in Real Motion is in a bearish divergence to price. 147 is the 6-month calendar range low. A move below would not be healthy.
All four of these Family members looking a bit tired in momentum.
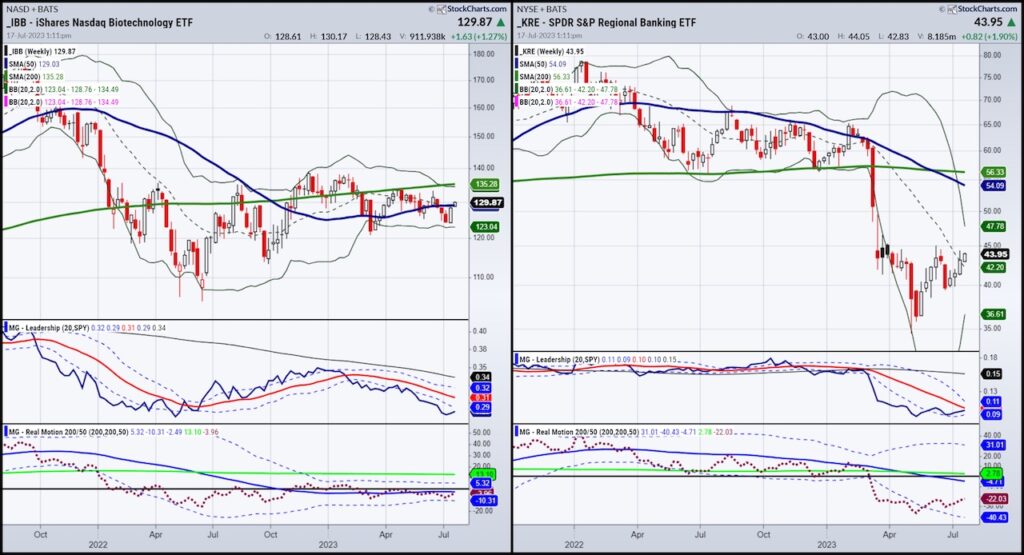
Biotechnology IBB is the second weakest Family member behind Regional Banks.
Just piercing the 50-WMA for an unconfirmed phase change to Recuperation, IBB has to clear 130 and then the 200-WMA at 135.30. Not surprising to see it well underperforming the SPY. Momentum in Real Motion has yet to catch up to the recent price action. The calendar range high, interestingly, is just over 130 or Monday’s high. We have eyes on this sector.
Regional Banks KRE are in a weekly bearish phase. A move over 45 would help and could also potentially give KRE a boost in leadership against the SPY. Momentum had a mean reversion back in mid-May. Nevertheless, the trip to the overhead 50 and 200-WMAs is far, yet perhaps not impossible.
As mentioned earlier the rates (FED on tap), dollar, earnings, gold, oil, food, and climate are all factors.
However, the most successful traders use the simplest formulas. Weekly charts, phase, leadership, momentum, and the July 6-month Calendar ranges should give you a statistical edge in this pivotal time.
Have a great week!
Twitter: @marketminute
The author may have a position in mentioned securities at the time of publication. Any opinions expressed herein are solely those of the author and do not represent the views or opinions of any other person or entity.


