S&P 500 (SPX) Daily Chart
The S&P 500 (SPX) rose 121 points last week to 2873, an increase of 4.4%. As well, Tesla (TSLA) rose by 10% after informal reports of strong sales.
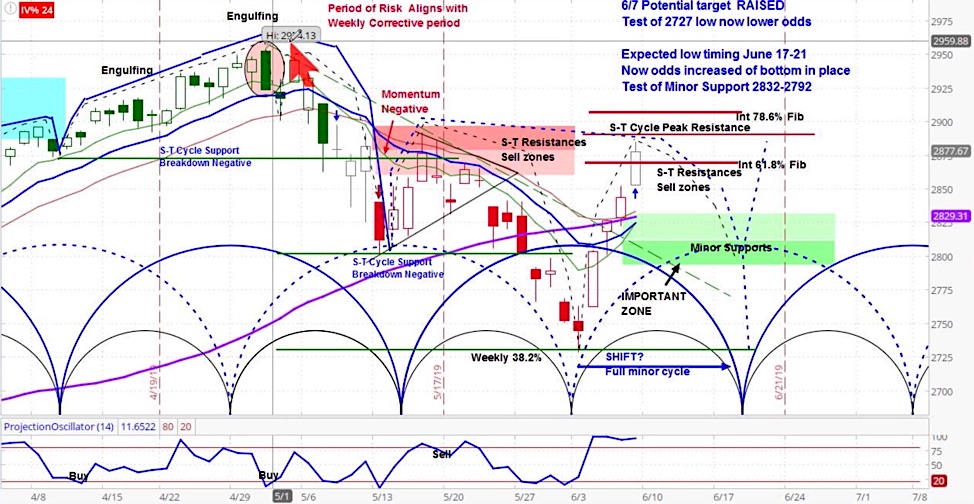
Our projection this week is for the SPX to decline to 2792-2832 with our expected bottom occurring between June 17-21.
The stock market rebounded strongly last week as a buying panic continued on Friday and the market solidified bets that the Federal Reserve would begin cutting rates in the near future, as I explained on the latest Market Week show.
The government reported nonfarm payroll figures for May rose by only 75,000 net new jobs, which was below the average estimate of 185,000. The April figure was also revised lower. If economic data continues to be weak, the Fed use it as a justification to cut rates.
Stock Market Outlook Video – Week of June 10, 2019
Our approach to technical analysis uses market cycles to project price action. Our analysis of the S&P 500 is for a down week and ultimately a test of the support zone between 2792-2832 by June 17-21.
The bottom line is that last week’s rally equates to a 100% retracement of the previous minor cycle. This show of strength increases the likelihood that the bottom is in.
For more from Slim, or to learn about cycle analysis, check out the askSlim Market Week show every Friday on our YouTube channel.
Twitter: @askslim
Any opinions expressed herein are solely those of the author, and do not in any way represent the views or opinions of any other person or entity.


 Ready To Break Out?")
")

