When a stock market correction takes shape, investors are filled with uncertainty and concern.
As prices head lower, there is an increase in “noise”, as traders and investors let their bullish / bearish emotions take over. Social media is a great example of this.
But after that move lower, there comes a move higher that takes away the anxiety before one final whoosh. Did that occur in the middle of October before one final whoosh into the end of October? Or is that unfolding right now?
V bottom (fast and furious in both directions) or A-B-C correction that may need one more leg lower? Mid-term elections, Federal Reserve meeting… logs of NOISE.
After many years of active investing, one thing is clear to me. Having a plan/process is what differentiates outperformers from underperformers.
It’s very difficult to consistently time tops and bottoms. So we need to have a plan that manages risk, includes when/where to take action, and typically keeps us in the game. And everyone’s process is different, especially from a timing standpoint (trader vs investor).
That is why I tend to share research and keep it as unbiased as I can. I want investors to find some value and education in what is presented. And I try to frame it within a given time frame.
Note that the chart below was built with Investors Business Daily’s product suite. I am an Investors Business Daily (IBD) partner and promote the use of their products – you can gain access here. It’s a great platform with a good mix of technical and fundamental data.
So where is the stock market now?
Well, as the title indicates, we are at a short-term crossroads. The coming week or two will likely decide if this is the start of something more bullish… or if we are set to head lower (for either a “retest” or a C wave to new lows).
For today’s chart update, we’ll look at the S&P 500 ETF (SPY) “daily” chart.
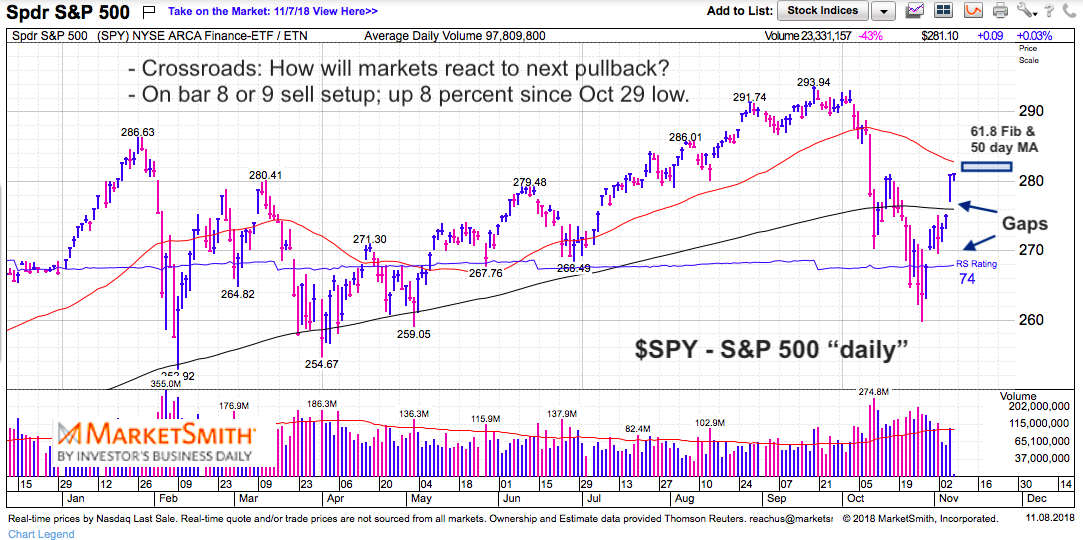
The S&P 500 (SPY) is currently testing the 61.8 Fibonacci retracement of the highs to lows for the correction ($280.92). Just overhead is the 50 day moving average at $282.46. These two areas will likely provide some resistance. Note that we are also on bar 8 of a 9 DeMark sell setup and have moved +8 percent higher since the October 29 low.
How we react to an initial move lower (selling) will be important in understanding whether this latest move higher was just a big bounce… or the start of something more bullish. There are two big gaps below. They don’t need to be filled, but one or both may be tested on a pullback.
As an active investor (swing trader), I lightened up yesterday and will lighten up further around the 50 day MA as we near potential short-term exhaustion (on a timing basis – today/tomorrow). I’m expecting a pause by early next week… then we see the “character” of the market and re-evaluate.
Best of luck to you on your trading/investing.
Twitter: @andrewnyquist
The author has a long position in $SPY at the time of publication. Any opinions expressed herein are solely those of the author, and do not in any way represent the views or opinions of any other person or entity.


 Pressuring Lower Price Support")


 Pressuring Lower Price Support")