Over the past several days, I’ve shared some high level charts and insights on Twitter and here on See It Market to help provide some framework for navigating a stock market crash.
My posts have focused on the broad stock indices and commodities, looking at key price levels and indicators, as well as sprinkling in some core trading / investing tenets such as patience, having a plan, and buying in increments.
Today, we look at some important Fibonacci price support levels across the major stock market indices: Nasdaq Composite, Dow Jones Industrial Average, and the S&P 500 Index.
If nothing else, it provides a big picture look at the stock market crash and current price discovery. I’m a top-down guy, even with short-term opportunities so it’s important to know how the broad market stacks up each day over given timeframes. Today’s charts are from a longer-term perspective… so it’s good to highlight where the stock market may exit the panic stage. Then we can look at sectors/stocks showing relative strength. I digress – more on this in another post
Note that the following MarketSmith charts are built with Investors Business Daily’s product suite.
I am an Investors Business Daily (IBD) partner and promote the use of their products. The entire platform offers a good mix of technical and fundamental data and education.
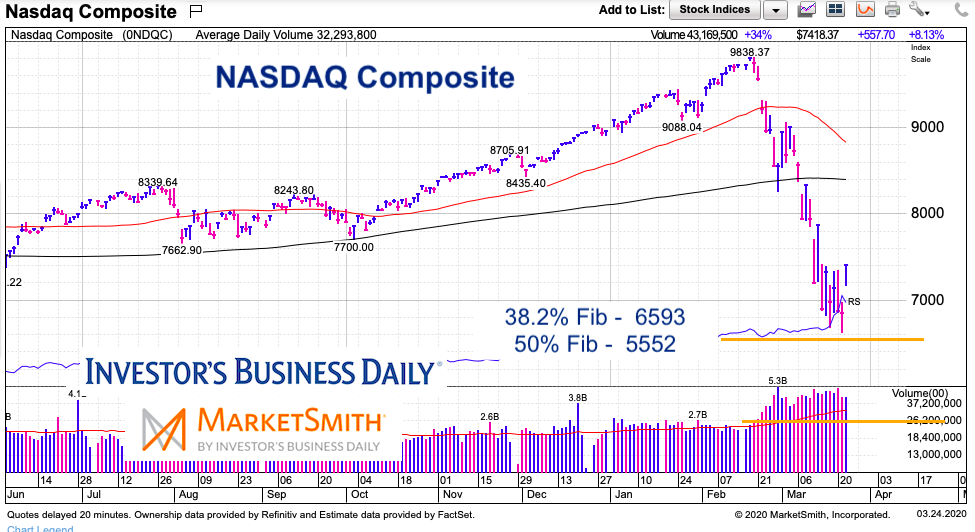
Nasdaq Composite Chart
Tech stocks have been a bull market leader so it’s good to watch this index (and the Nasdaq 100). Note that the Nasdaq closed green on Monday (while others were down 2 percent or more), hinting that a rally might be unfolding… then we exploded Tuesday.
Key Fibonacci Levels: It’s noteworthy that the Nasdaq fell as low as 6631 on Monday – this was within 68 points of the 38.2 percent Fibonacci retracement of the entire 11 year bull market at 6563. So watch this level. If we see another wave of panic below, we have very strong support at the 50 percent Fibonacci level (5552). Let’s hope it doesn’t come to that.
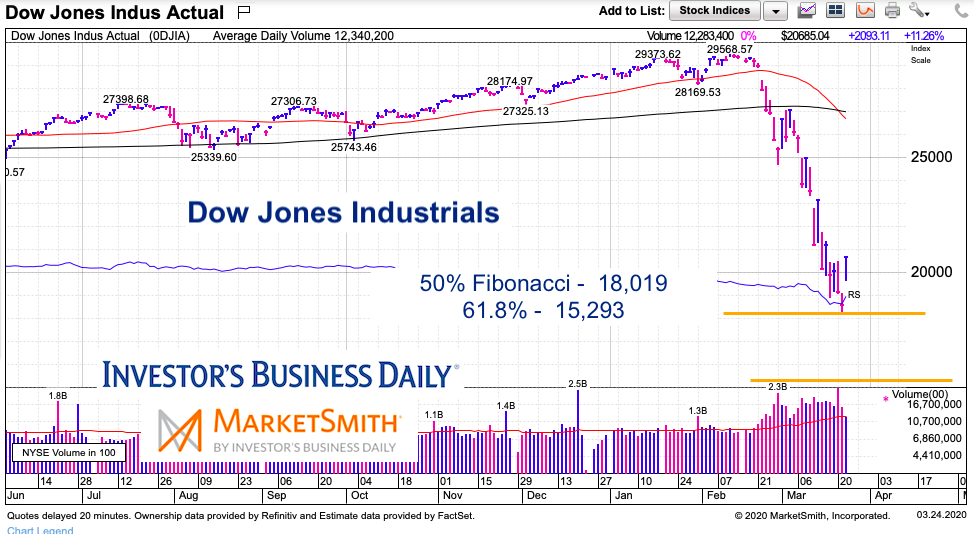
Dow Jones Industrial Average Chart
Key Fibonacci Levels: The Dow Jones Industrial Average has been crushed during the stock market crash, falling 38.4% (from its 2020 highs to lows). The current low checked in at 18,217 only 198 points above the 50 percent Fibonacci retracement of the entire 11 year bull market at 18,019.
So this area is important. If the market panics again, the next major Fibonacci retracement level is 15,293 (the 61.8 percent Fib). Again, let’s hope it doesn’t come to that.
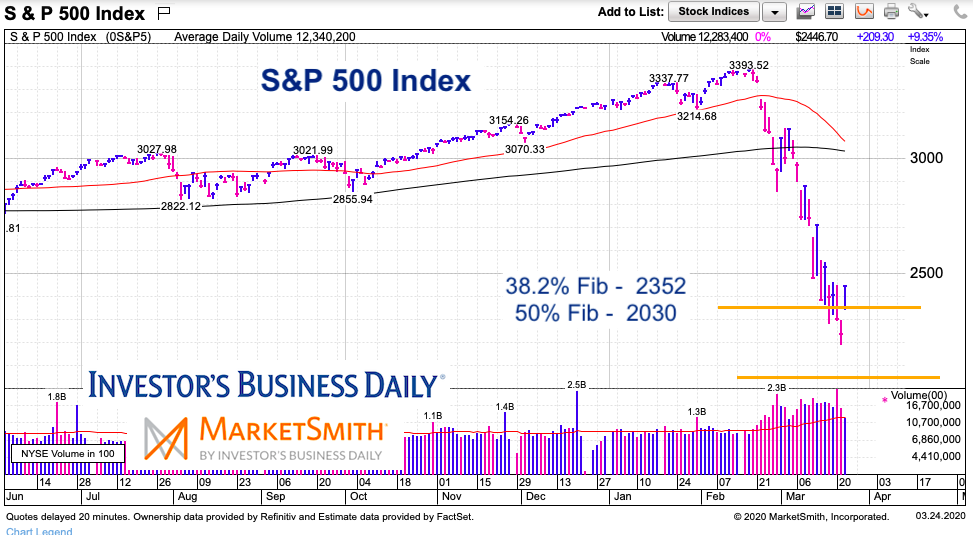
S&P 500 Index Chart
The Nasdaq has held up the best of the 3 stock indices with the Dow Industrials being the worst. The S&P 500 Index is somewhere in between.
Key Fibonacci Levels: Looking at “entire bull market” Fibonacci retracements for the S&P 500, we have the 38.2 percent level at 2352. The S&P 500 closed below this level twice, hitting an intraday low of 2191 Monday. It closed well above that level on Tuesday at 2447. However, should another decline occur that takes out recent lows, there’s a strong 50 percent Fibonacci retracement level at 2030. Again (again), we hope it doesn’t come to that.
Twitter: @andrewnyquist
The author may have a position in mentioned securities at the time of publication. Any opinions expressed herein are solely those of the author, and do not in any way represent the views or opinions of any other person or entity.

: Showing Some Signs of Emerging Strength")

