Stocks have stalled out in September. Is this an ominous sign of a bigger stock market decline to come? Or is this simply an ongoing bullish respite for an overheated market?
I’m watching a few underperforming “important” sector ETFs that are currently testing key price support as indicators of what may come. Note that these are not watched in a vacuum, but along with other core internal indicators like breadth, momentum, etc.
These sector ETFs include the Financials (XLF), Real Estate (XLRE), and the Retail (XRT) / Consumer (XLY) area. Today, we focus on the latter grouping. But note that all three are trading heavy and near important short-term resistance.
Below I have posted annotated daily charts of the SPDR Retail Sector ETF (XRT) and the SPDR Consumer Discretionary Sector ETF (XLY). Both are important components of the economy and both have been trading sideways for a while… and both are at important support! How they fare will be telling. Let’s dig in.
Note that the following MarketSmith charts are built with Investors Business Daily’s product suite.
I am an Investors Business Daily (IBD) partner and promote the use of their products. The entire platform offers a good mix of analysts, education, and technical and fundamental data.
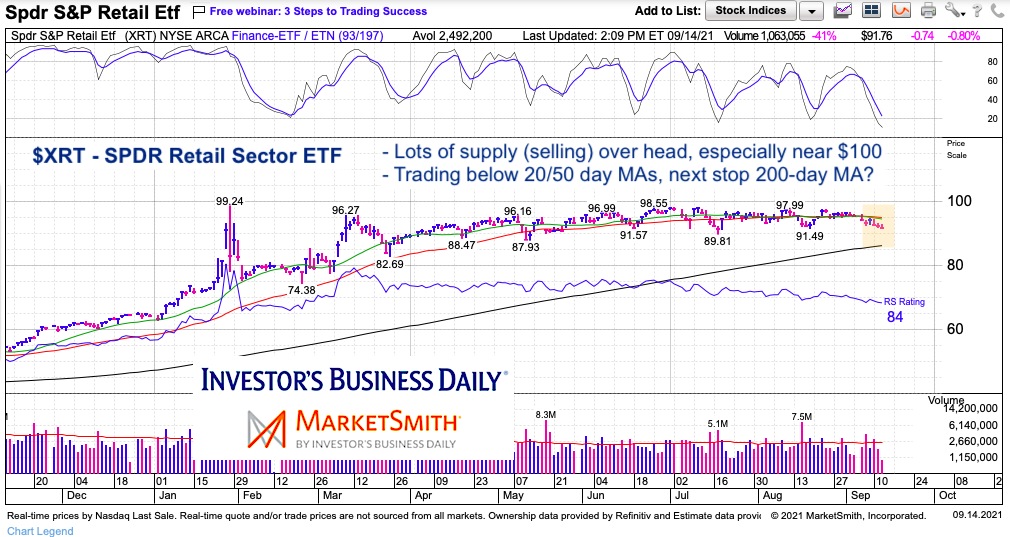
$XRT SPDR Retail Sector Chart
The Retail Sector ETF (XRT) has been trading in a narrow channel for months. But momentum has been waning for since spring.
And more recently, price has declined back toward the lower end of the channel and is below the 20 and 50-day moving averages. It’s kind of in no man’s land and may be setting up for a test of the 200-day moving average. If that’s the case, the stock market pullback will linger a bit.
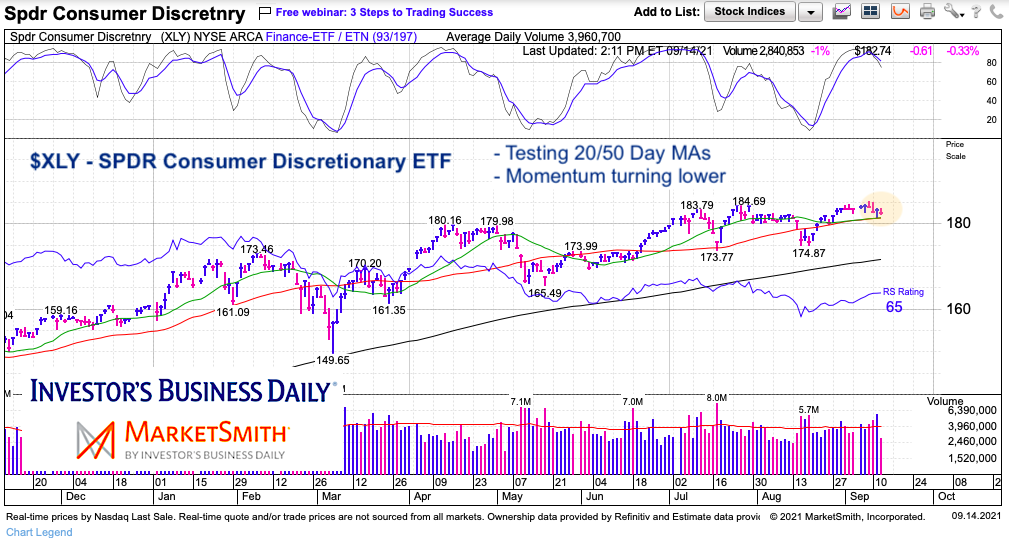
$XLY Consumer Discretionary Sector Chart
This chart may have more consequences. This consumer sector ETF represents consumer spending on wants rather than needs. When this area is performing well, the economy usually is too.
Here we see the potential for XLY to roll over. Price is turning lower along with momentum. However, XLY is sitting right on its 20 and 50 day moving averages (key support). If those hold, then bulls will cheer. If not, the stock market likely pulls back further. The 200-day moving average is nearly 7 percent lower.
Twitter: @andrewnyquist
The author may have a position in mentioned securities at the time of publication. Any opinions expressed herein are solely those of the author, and do not in any way represent the views or opinions of any other person or entity.


: Showing Some Signs of Emerging Strength")
