The volatility today is crazy. No other way to put it.
It’s not that we haven’t seen similar in other periods of history / bear markets, but it’s always eye opening as you go through it in real time.
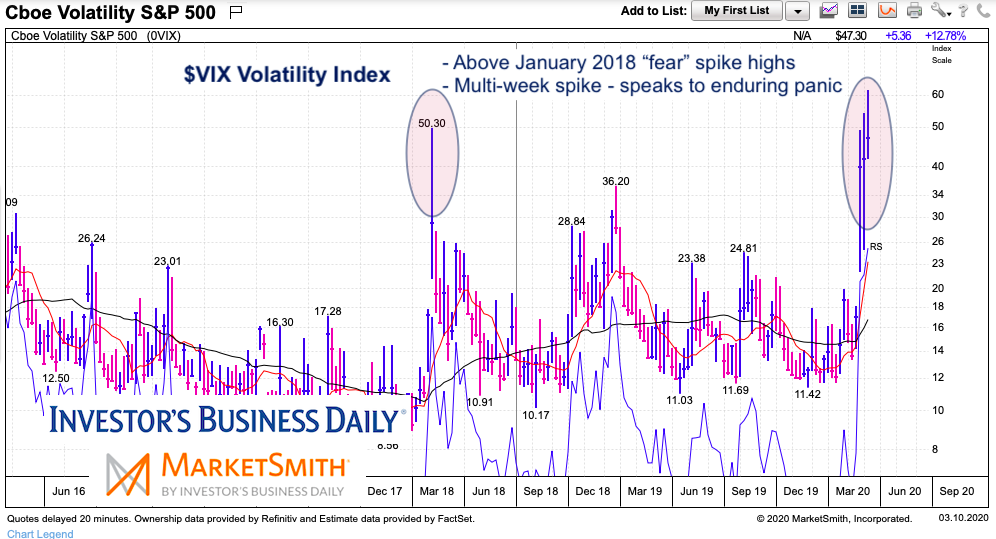
That said, one thing that I have noticed about the 2020 stock market correction / bear market is that the volatility has staying power. It’s enduring.
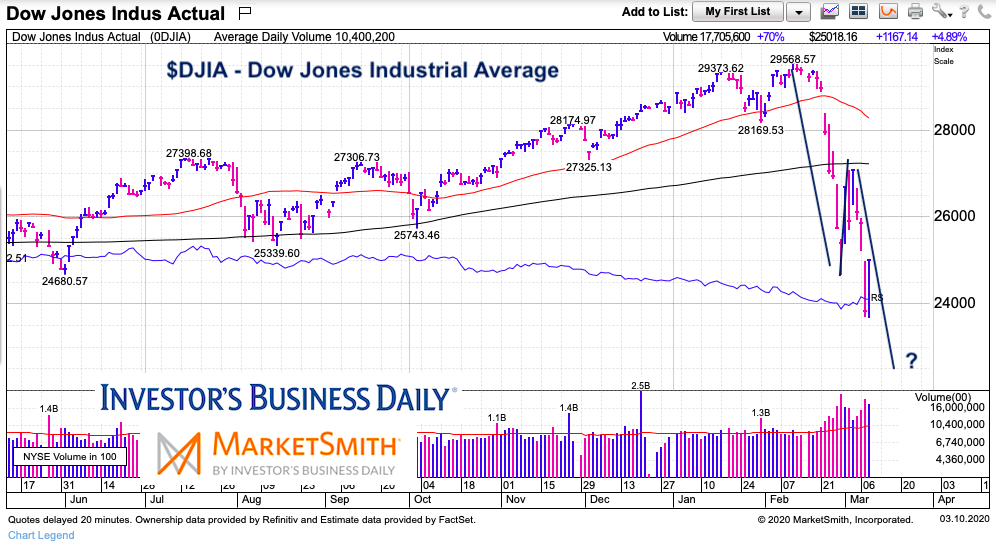
We’ll discuss recent readings on the VIX Volatility Index, along with a potential A-B-C measured move price objective to the downside for the Dow Jones Industrial Average in the charts below. Again, just a brief note with a couple insights…
Note that the following MarketSmith charts are built with Investors Business Daily’s product suite.
I am an Investors Business Daily (IBD) partner and promote the use of their products. The entire platform offers a good mix of technical and fundamental data and education.
VIX Volatility Index “weekly” Chart
As you can see, the VIX has remained elevated near or above 50 going on the 3rd week. That’s made this a prolonged panic / capitulation. And that’s hard to trade on any level – patience and a plan are required in times like these.
Dow Jones Industrial Average “daily” Chart
Should be be going through an A-B-C measured move correction, then we could expect to test 22,000 – 22,500 in coming days/weeks. Just a potential price target (and not a forecast). Again, have a plan.
Twitter: @andrewnyquist
The author may have a position in mentioned securities at the time of publication. Any opinions expressed herein are solely those of the author, and do not in any way represent the views or opinions of any other person or entity.
: Creating Bullish Divergence?")


 and Semiconductors (SMH): Concerning Price Pattern?")


