Key stock market indices continue to struggle beneath 800 pound Fibonacci extension levels (resistance).
In today’s “6-pack” chart, we illustrate these key bull/bear lines for investors – see below.
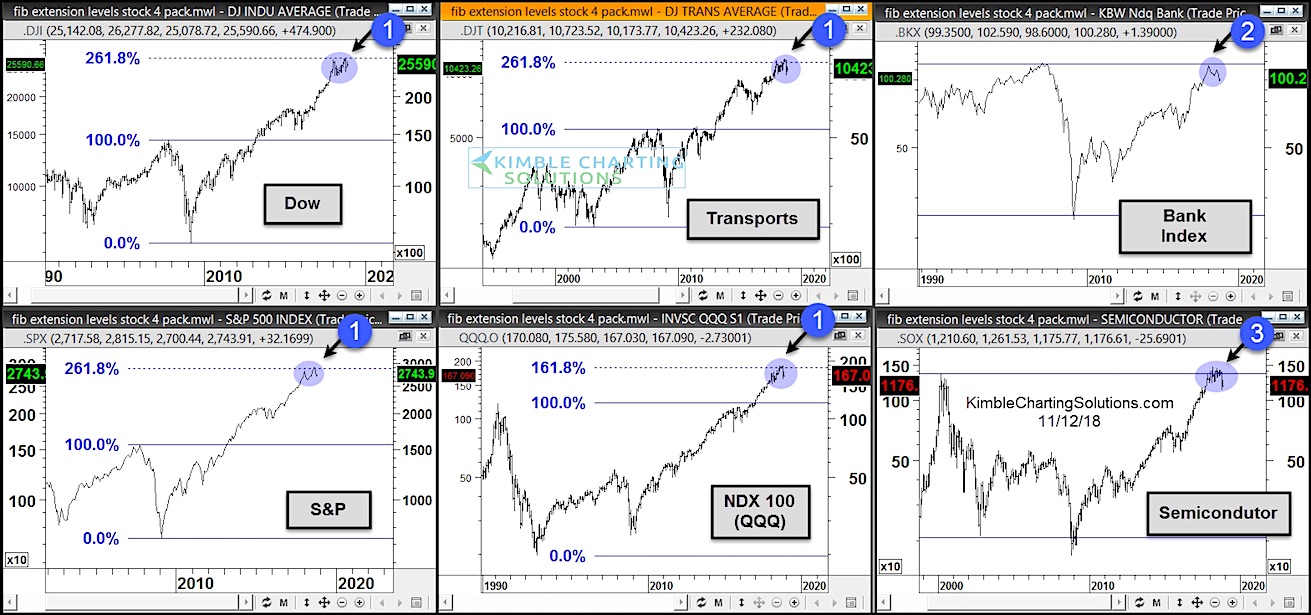
The Dow Jones Industrials, Transports, S&P 500, and Nasdaq 100 are all experiencing weakness and selling pressure at long-term fibonacci extension levels each at (1).
But the overhead resistance spreads to other key sectors like the Banks and Semiconductors.
The Banks are experiencing weakness at the 2007 highs at (2) and the Semiconductors are experiencing weakness at the 2000 highs at (3).
Expect market weakness (or consolidation) to continue until these stock indexes and key market sectors breakout above resistance. Stay tuned!
6-Pack of Stock Market Indices – Long-Term Resistance
Note that KimbleCharting is offering a 2 week Free trial to See It Market readers. Just send me an email to services@kimblechartingsolutions.com for details to get set up.
Twitter: @KimbleCharting
Any opinions expressed herein are solely those of the author, and do not in any way represent the views or opinions of any other person or entity.


: Showing Some Signs of Emerging Strength")
