Reserve Chairman Jerome Powell’s speech this past week cautioned against prematurely loosening monetary policy.
Powell’s speech reminds us that the Fed is focused on keeping inflation under control.
Nonetheless, what we also learned this week is that technical matter. It is far more crucial to monitor price movements and utilize technical indicators for momentum and market direction.
The overall market has been heading higher, and both the S&P 500 (SPY) and Russell 2000 (IWM) have crossed critical areas of support. The 50-day moving average in fact, cleared in all indices and most key sectors. Now, we focus on the overhead resistance levels at higher price targets.
We turn to the charts of a couple of members of the Economic Modern Family’s to gain clarity.
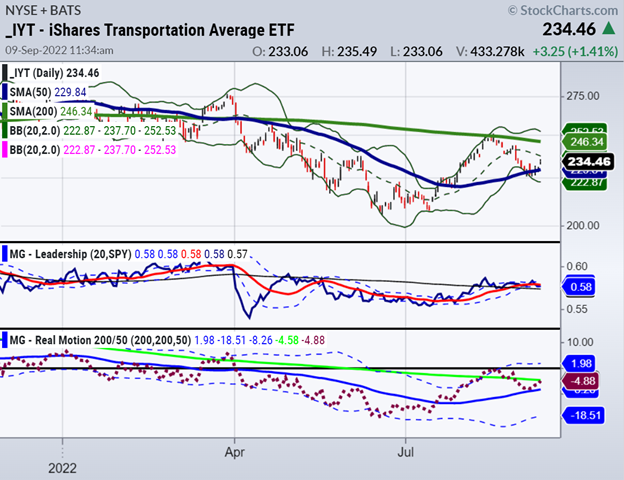
Transports “Trans” (IYT) and Regional Banks “Prodigal Son” (KRE) are in focus along with SPY.
Not in the family, SPY is however, a reliable indication of the health of large-cap and small-cap companies.
IYT has crossed the 50-day moving average. We featured this sector in particular both in blogs and on the media last week. Why? Because if goods are in demand and people are moving, then things are not so bad as many would have you believe.
Momentum indicators illustrate resistance however. Hence, we will watch the 50-DMA to hold but also anticipate selling to come in at around the 240 level. The 50-DMA is the go-to right now everywhere.
The 200-DMA has stopped the rallies since the big breakdown in April.
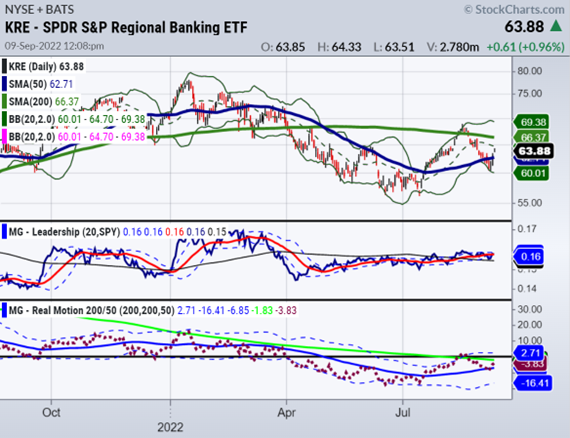
Similarly, “Prodigal Son” regional banking (KRE) is also above the 50-day moving average and fighting hard to regain a daily, weekly, and monthly longer-term uptrend.
KRE has a lot of work to do to rally over 65.00 and then hold.
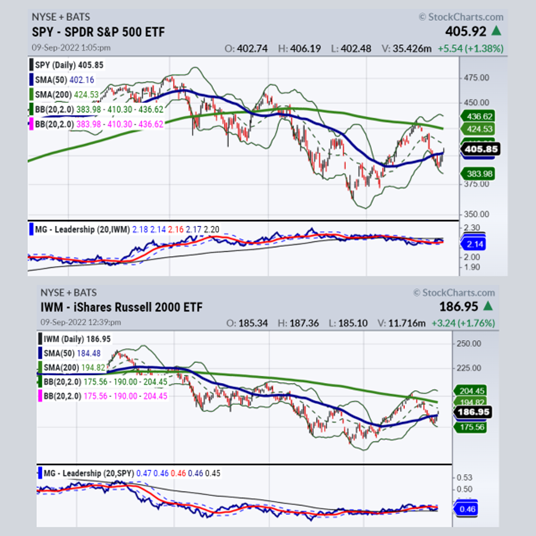
While IYT and KRE crossed their 50-DMAs last Wednesday, SPY and IWM finally caught up on Friday. Now, both must confirm by holding those levels.
IWM has better momentum according to our MarketGauge Real Motion indicator.
Hopefully, that means something next week.
How long will this rally last?
Note the levels on DIA and QQQ listed below.
Also, get ready for some key economic numbers such as CPI. And most importantly, think “active”, know your risk, take profits on rallies AND, til further notice this is still a bear market rally using phases as our navigation.
This week on media, Mish talked a lot about the macro and the technical-please be sure to have a listen.
Traders can gain an advantage in the market by using MarketGauge’s proprietary technical analysis tools, such as the triple play indicator, comparable market phases, downward momentum, volume analysis, and positive trend strength (TSI), and used in conjunction with the Modern Family to make better-informed trading decisions.
Mish’s latest Media Interviews:
NASDAQ Talks with Jill Malandrino 09-10-22
Opening Bell Cheddar TV 09-10-22
Stock Market ETFs Trading Analysis & Summary:
S&P 500 (SPY) 402 (50-DMA) must hold and if does, next 410
Russell 2000 (IWM) 184-185 (50-DMA) must old and if it does 190 next
Dow Jones Industrials (DIA) Closed at 322 (50-DMA) on the button
Nasdaq (QQQ) Closed at 307 (50-DMA) on the button.
KRE (Regional Banks) 62.70 (50-DMA) held now 65 must clear
SMH (Semiconductors) STILL the weakest-215 needs to hold
IYT (Transportation) 232 must hold (50-DMA) 240 resistance
IBB (Biotechnology) 125 support 128.50 (200-DMA)
XRT (Retail) Must hold 65 area now, and if fails could be early warning sign
Twitter: @marketminute
The author may have a position in mentioned securities at the time of publication. Any opinions expressed herein are solely those of the author and do not represent the views or opinions of any other person or entity.


