On a recent road trip, we saw this sign.
We stopped so I could take a photo, but also so we could ponder what wild animals should we be on the lookout for. This pondering may apply to today’s stock market.
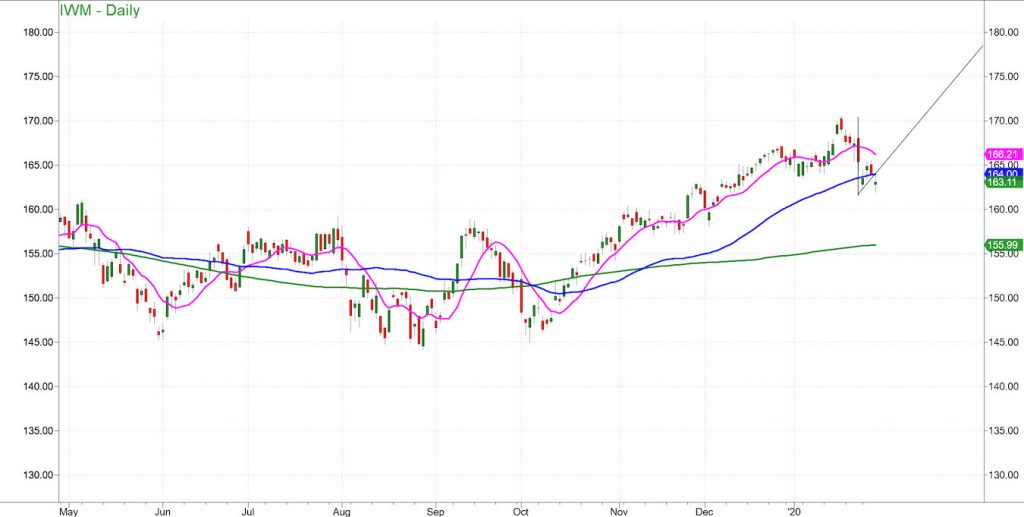
To the question “Was that the V-bottom (in the Russell 2000 IWM) we have enjoyed throughout most corrections, or a bear flag and the start of much nastier downturn coming soon?”
The answer is not sure yet.
We saw the critical support that must hold.
Last night we looked at the weekly charts on our core stock market ETFs (the Economic Modern Family).
Weekly charts often give you the chance to step back and look at a bigger picture.
Retail XRT for example, fell right to its 50 and 200-week moving averages and thus far, held.
We all slowed down our buying, and now we wait to see if wild bears cross the road.
With tomorrow the end of the month, we should know more about the next major direction of the market.
Looking at the Daily chart of the Russell 2000 IWM, speaking of bears, the bear flag did indeed break.
The measured move of the break puts IWM at around 160.
Yet, IWM does not act alone.
Granny Retail XRT held the weekly MAs, as did Regional Banks KRE and Transportation IYT.
If IWM holds 162 and returns back above the 50-Daily Moving Average or 164.01, then put the car in drive and proceed with caution.
Today we saw that bulls can be just as wild as bears.
Yet, should Retail, Transportation or Regional Banks break below the support or the lows they had today, then make a U-turn as to not get into a scrap with any wild bears.
Plant Your Money Tree made it to the Best Wealth Books of All Time

I’m happy to announce that my book, “Plant Your Money Tree: A Guide to Growing Your Wealth”, made it to BookAuthority’s Best Wealth Books of All Time:
BookAuthority collects and ranks the best books in the world, and it is a great honor to get this kind of recognition. Thank you for all your support!
The book is available for purchase on Amazon.
S&P 500 (SPY) A weekly close under 320 will not look healthy. 329.50 resistance.
Russell 2000 (IWM) Price support at 162; must clear 163.80-164.07
Dow Jones Industrials (DIA) 284.12 is the 50-day moving average with 290.35 resistance.
Nasdaq (QQQ) 212.24 is price support with 222.70 resistance.
KRE (Regional Banks) 54.00 is the 200-day moving average. 57.00 is price resistance.
SMH (Semiconductors) Major price support at 139.77. 145.40 is price resistance.
IYT (Transportation) 190 is the next price support. 195.50 is pivotal.
IBB (Biotechnology) 115.40 price support with 119 resistance.
XRT (Retail) 43 price support and 45 resistance.
Volatility Index (VXX) One day wonder.
Twitter: @marketminute
The author may have a position in the mentioned securities at the time of publication. Any opinions expressed herein are solely those of the author, and do not in any way represent the views or opinions of any other person or entity.


