Fibonacci Support Chart – S&P 500 Index and Dow Jones Industrial Average
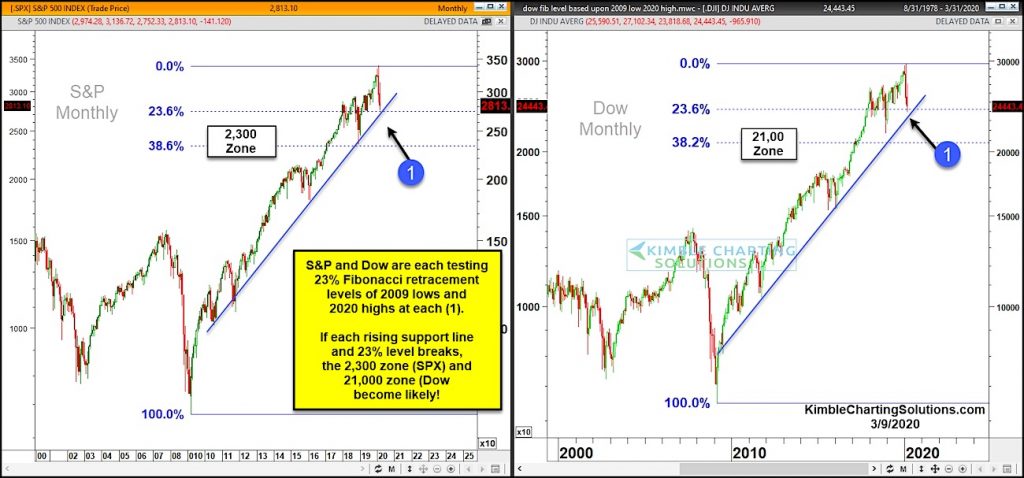
The thrust lower in the stock market has two major indices testing important Fibonacci price support levels (measured from the 2009 lows to 2020 highs).
The S&P 500 Index and Dow Jones Industrial Average are testing key 23.6 Fibonacci “trend” support areas at each (1). Not only is the 23.6 Fib important as a trend gauge, but each stock index is also testing its up-trend support line.
Until proven differently these are strong “dual support” zones.
BUT, if they fail we may well see the next Fibonacci support level come into play – the 38.2 Fib. For the S&P 500, that’s at 2,300 and for the Dow that’s at 21,000.
Bulls sure hope we hold this dual support area! Stay tuned!
Note that KimbleCharting is offering a 2 week Free trial to See It Market readers. Just send me an email to services@kimblechartingsolutions.com for details to get set up.
Twitter: @KimbleCharting
Any opinions expressed herein are solely those of the author, and do not in any way represent the views or opinions of any other person or entity.


")

