S&P 500 Index versus 10 Year US Treasury Yield Chart
There is a tight relationship between stocks, bond yields, and the economy.
Especially in times of steep stock market corrections, bear markets, and economic uncertainty.
The simple way of putting it is that treasury bond yields go down (interest rates) at the same time that the stock market declines.
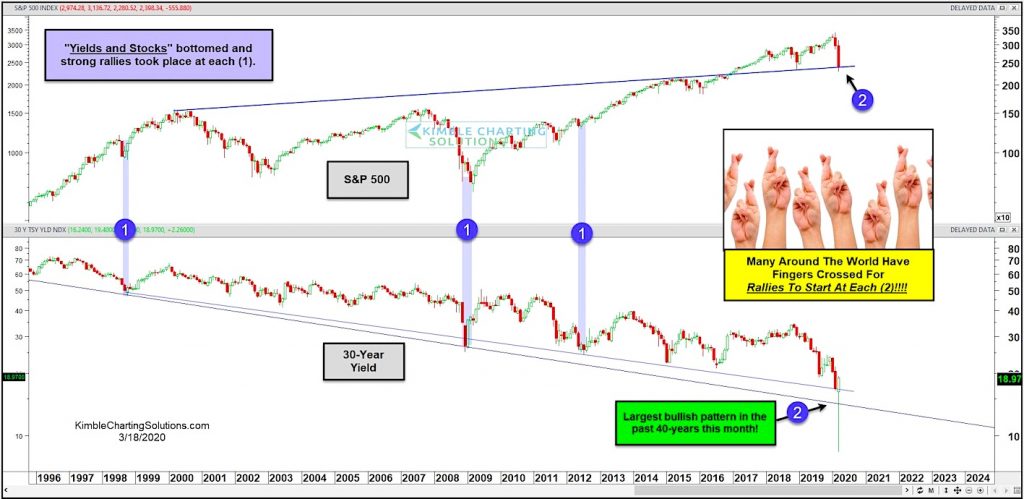
In today’s chart, we take that theory one step further and highlight a number of occasions where stocks (the S&P 500 Index) and bond yields (the 10-Year US Treasury Yield) bottomed together – see each point (1).
Stock market bulls hope that now is one of those times (see each point 2). Bond yields have fallen sharply and stocks are down over 30 percent.
As well, the S&P 500 Index is testing an important trend line support at (2). Many investors around the world have their fingers crossed that rallies in stocks and bond yields start here. Stay tuned!
Note that KimbleCharting is offering a 2 week Free trial to See It Market readers. Just send me an email to services@kimblechartingsolutions.com for details to get set up.
Twitter: @KimbleCharting
Any opinions expressed herein are solely those of the author, and do not in any way represent the views or opinions of any other person or entity.

: Worrisome to Broader Market?")
