Key Stock Market Takeaways:
– Large-caps are leading but others are following.
– Watch industry group trends and new high list for confirmation.
– Optimism rebuild outpacing momentum gains.
The stock market’s quick shift from weakness in the wake of coronavirus news to a return to new highs has led to some to express concern that rally participation has narrowed.
Rather than letting fears of divergence cause us to jump at shadows, a better approach is to shine a light on the actual data.
The S&P 500 Index and NASDAQ Composite may be out front, but other areas of the market are following their lead.
Put simply, there is not significant evidence that the rally has gotten troublingly narrow.
That being said, there is still room for improvement and, to build on our comments from last week, we are seeing more evidence of renewed optimism than a meaningful expansion in upside momentum.
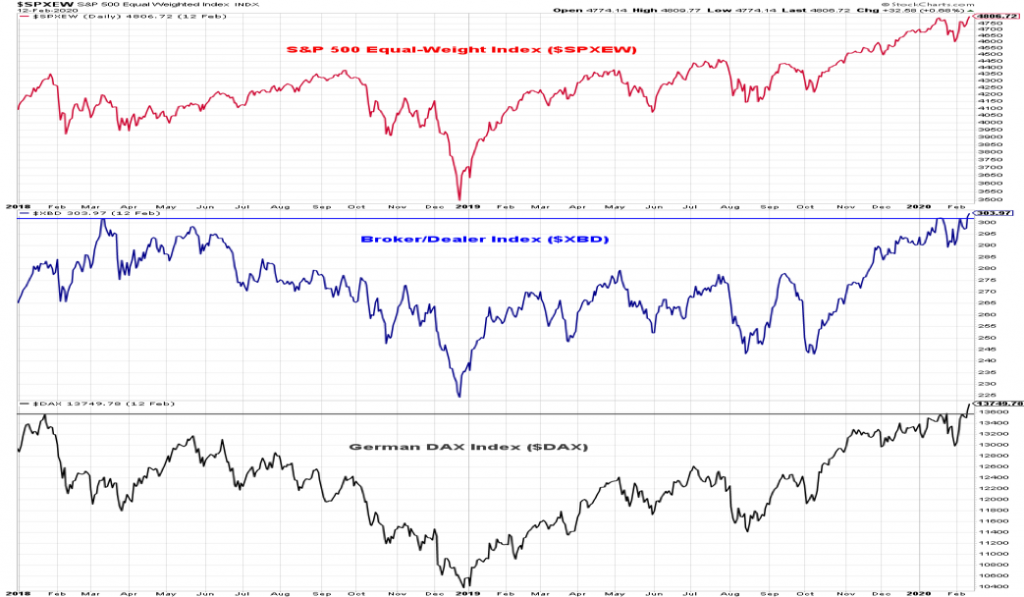
New highs on the S&P 500 this week came with an impressive array of support. The S&P 500 equal-weight index surpassed its mid-January peak, while the Broker/Dealer Index and the German DAX both broke above early 2018 peak levels. This diversity of indexes moving to new highs suggests rally participation has been broad.
Not all areas of the market have moved to new highs. In those cases we are looking for improvement versus deterioration. Mid-caps and small-caps are on the cusp of new 52-week highs and getting through those mid-January levels would be a sign of strength (making new highs is bullish, a failure to make new highs is not).
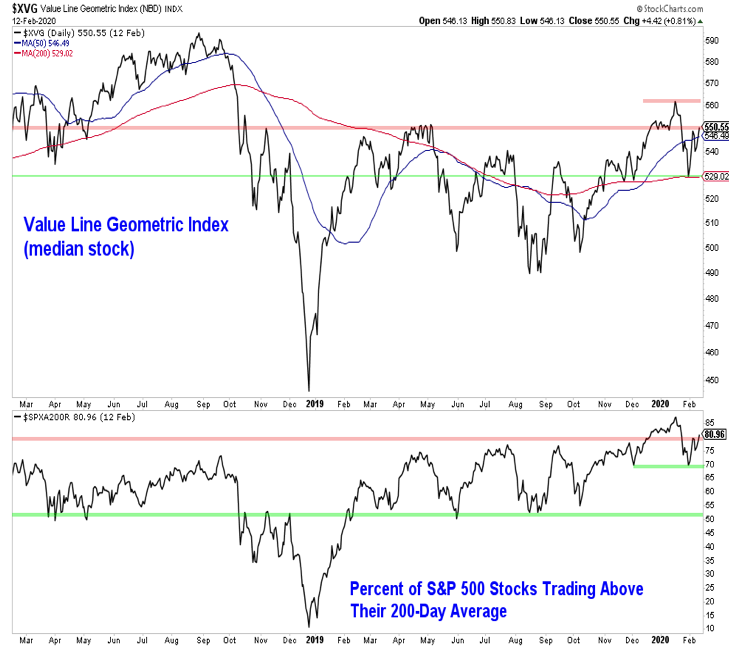
A look inside the stock market indexes can also provide a sense of rally participation. The Value Line Geometric Index (which approximates the performance of the median stock) and the percentage of stocks above their 200-day averages are both moving higher but have not yet reached their January peak levels.
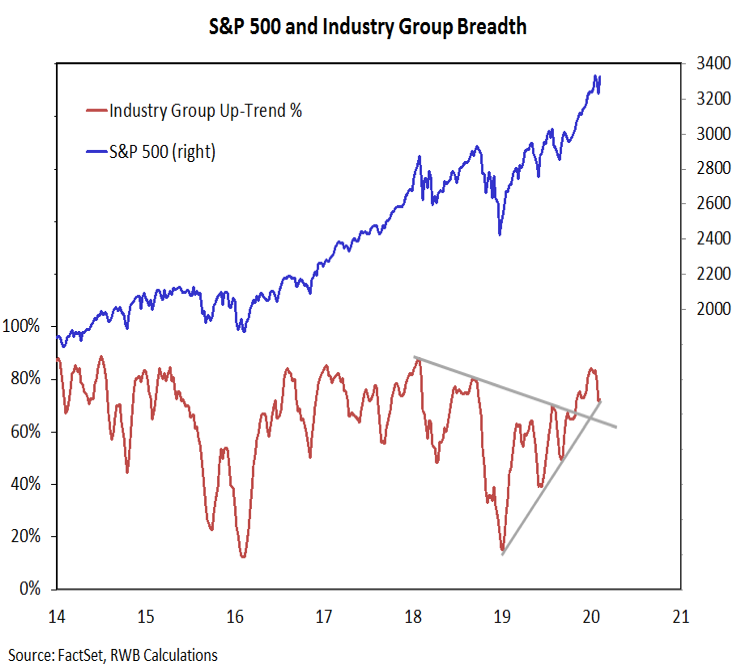
The speed with which the indexes have moved to new highs, as well as the more uneven recovery by mid-cap and small-cap areas of the market has weighed on our industry group trend indicator. This weekly indicator measures the strength of trends at the industry group level across large-caps, mid-caps and small-caps. It has stopped falling, but has yet to meaningfully move higher. A failure for it to surpass its mid-January level would raise some concern.
Sector-level trends have improved on the rally, and our trend indicator that measures price, momentum ad breadth trends across the sectors has moved back into positive territory. This week, eight of the 11 sectors in the S&P 500 have made new highs.
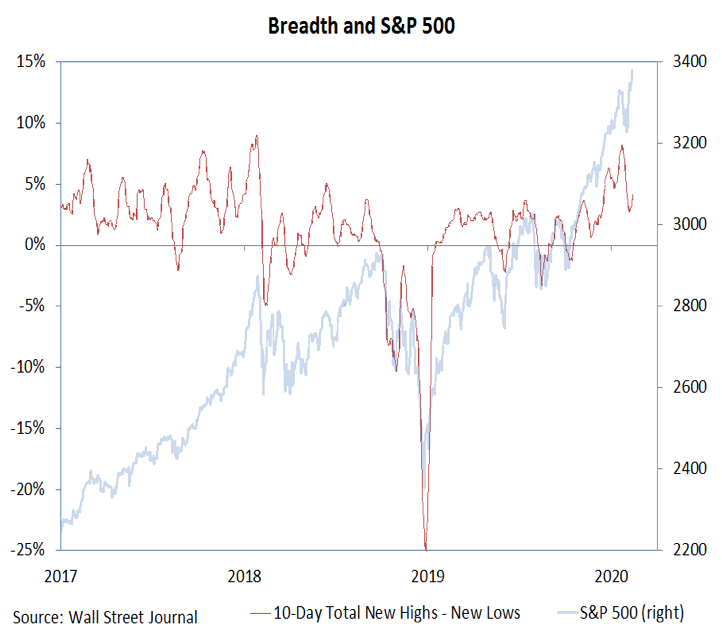
The new highs being recorded at the index and sector-level have struggled to translate into new highs at the stock level. The number of stocks making new highs on the S&P 500 has remained shy of the peak from January, though the NYSE new high list surpassed its January high (on the NYSE, we witnessed a higher high in new highs).
Across the NYSE+NASDAQ, net new highs are again expanding. As the rally progresses and subsequent consolidations emerge this year, we will be keeping a close eye on the trend in new highs. A repeat of the pattern from early 2018 (an expansion in the new low list and lower levels of new highs) would be a cause for concern. Right now that appears premature.
While the rally to new highs has seen broad participation, it has still lacked buying intensity. Up/down volume has been muted on rallies and we have not (yet) seen another breadth thrust signal.
What has started to emerge (and bears monitoring) is evidence of renewed optimism. The individual weekly sentiment surveys we watch most closely (II, NAAIM, AAII) also showed more bullishness this week, the NDR Crowd Sentiment Poll is back into the extreme optimism zone. Optimism is being expressed in action as well. Put/call ratios have turned sharply lower and equity ETF inflows are surging ($18 billion last week and another $6+ billion in the first three days this week).
Twitter: @WillieDelwiche
Any opinions expressed herein are solely those of the author, and do not in any way represent the views or opinions of any other person or entity.


