Today we’re looking at market breadth in the form of the cumulative advance decline lines.
Market breadth at a high level essentially means market participation, so when the market is on the move, it tells you how many stocks are participating in the trend.
Each day, the cumulative advance decline line takes the stocks advancing (closing higher than yesterday’s close) less the stocks declining (closing lower than yesterday’s close).
You are left with a net number of advancers minus decliners, and these values accumulate over time.
At the top of this chart we’re looking at the S&P 500 Index INDEXSP: .INX on a closing basis, and below that we have the cumulative advance decline line for the S&P 500, the NYSE, the mid cap index, and the small cap index.
I like to look at cumulative advance decline lines across the cap tiers, from large to mid to small, as this shows which stocks are participating in the market trend.
S&P 500 Index – Market Breadth
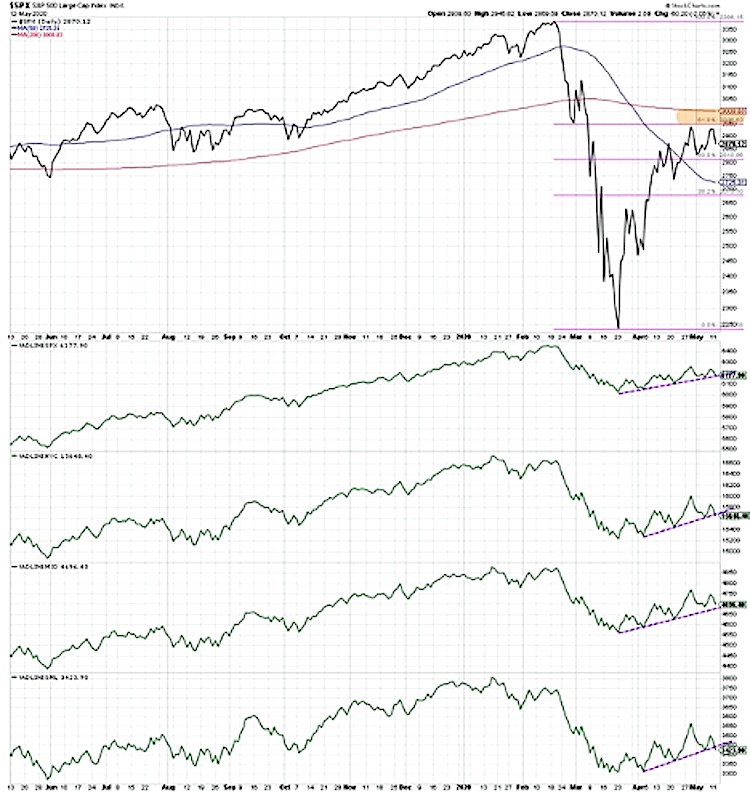
Over the last six weeks, after the initial V bottom and subsequent pullback, we’ve seen a continued uptrend of higher highs for the S&P 500. This week, however, we may have put in a lower high. If we get a follow through and a break below the most recent swing low, this would suggest a short term tactical downtrend. But until then, we just seem to be establishing a bit of a short term peak.
The question now is, have we exhausted this bear market rally and are we beginning the next leg down? Looking at the cumulative advance decline lines are one way to answer that question.
Over the last six weeks these breadth measures have been drifting higher. They have continued a trend of higher peaks and higher valleys, or higher highs and higher lows. With this week’s selloff, the S&P 500 advance decline line is now right back down to the trend line using the lows over the last six weeks.
It’s important to note that the breadth indicators on this chart haven’t updated yet because it’s right after the close. I’m curious to see if these cumulative advance decline lines break down below support, especially with the bearish engulfing patterns that have emerged on the S&P 500, the Nasdaq 100, and even stocks that have recently broken to new highs. All this suggests short term weakness.
To watch this in video format, just head over to my YouTube Channel!
This is a market that has been perceived as a large or mega cap led market, and over the long term this has certainly been the case. Looking at the relative performance of the S&P vs the small cap index, the S&P has been a consistent outperformer in that relationship.
But if you look since the market low in mid/late March, the strongest performer of these four buckets is actually the mid cap index. It will be interesting to see if these advance decline lines break down through trend line support and then break down through their most recent swing lows. If this recent pattern of higher peaks and higher valleys reverses and we see lower highs and lower lows, this suggests that the breadth characteristics are transitioning from a period of strength to a period of weakness.
I could see a situation where the S&P 500 actually holds above 2750 or 2800. But if we see these cumulative advance decline lines start to roll over, the very last thing to happen would be the S&P actually breaks down through price support. In many cases, breadth indicators will begin to show weakness well before the price begins to react to the negativity.
I’m monitoring market breadth in the form of the cumulative advance decline lines for the S&P and other cap tiers. And based on the bearish engulfing pattern that we’ve seen on the S&P 500 this week, I suspect a break in these trend lines and subsequent break down through support will likely happen soon.
Twitter: @DKellerCMT
The author does not have a position in mentioned securities at the time of publication. Any opinions expressed herein are solely those of the author, and do not in any way represent the views or opinions of any other person or entity.

: Worrisome to Broader Market?")

