 As the market continues to be choppy and rangebound, it certainly seems to be following certain levels. The S&P 500 is currently pushing up against a resistance band around 1885. And should it break higher, many will be left wondering if 3 times is a charm in breaking out to new highs?
Looking at the chart below resistance lies at 1885 and 1900. And the move higher is supported by a series of higher lows and candle tails (buying). A strong move higher with follow through above 1900 could see a new leg higher. But the key there is follow through.
However, if the most recent lows are snapped, the S&P 500 will likely be magnetized back towards the 1850 level (late 2013/early 2014 resistance). This would start to put pressure on the index and increase the likelihood of a further move to the downside. See chart below.
S&P 500 Daily Chart with support and resistance levels
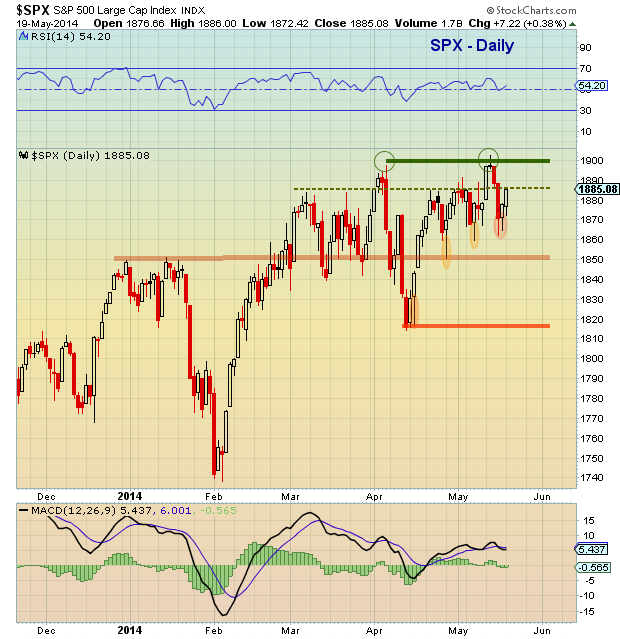
Keep an eye on 1900 as that is the elephant in the room. Lots of eyes there, so the index will need more than a close or poke above that level to start a new leg higher. Trade safe.
No position in any of the mentioned securities at the time of publication. Any opinions expressed herein are solely those of the author, and do not in any way represent the views or opinions of any other person or entity.
: Creating Bullish Divergence?")

 and Semiconductors (SMH): Concerning Price Pattern?")
 and Semiconductors (SMH): Concerning Price Pattern?")


