Those who read our Daily and follow us on the media know that we talk a lot about risk gauges.
The big focus for me personally is the relationship between the S&P 500 and the long bonds.
The other 2 I watch are the relationships between junk and long bonds, and the S&P 500 and gold.
All have flashed risk on for some time.
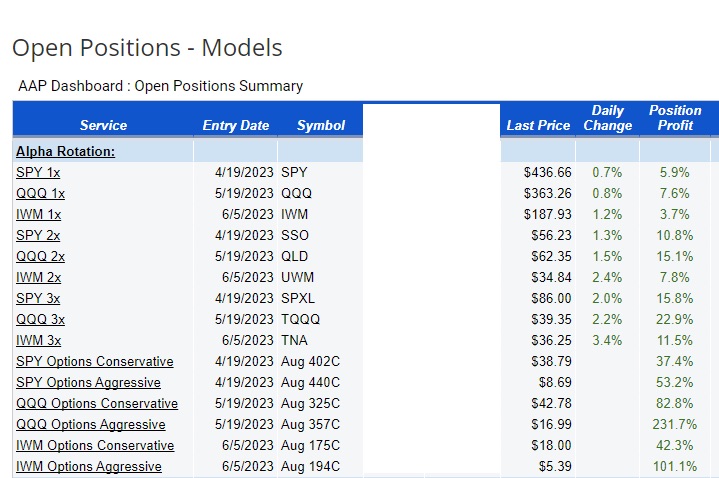
Our Alpha Rotation quantitative strategy that MarketGauge developed uses a combination of market internals, proprietary risk gauges and market phases to determine risk on or off.
If the math is aligned, we allocate to the major indices, U.S. treasures or cash.
We then use both non-leveraged and leveraged versions for our entries.
Furthermore, the model is built with initial risk parameters and profit targets. All automated.
The point of my showing you this today is to show you how the “math” has been smart. And the rally has been technical.
While the fundamental number crunching analysts hate this rally, the technical traders and retail investors have had a party.
Hence, should the risk gauges change, it stands to reason the now trailing stops will be hit.
It also stands to reason that the long bonds will show us the way.
Wednesday after the FOMC we said, “We love to watch the Long Bonds as they are a key factor in our risk gauges that help us see risk on/off.”
We asked, “What might the Long Bonds be telling us?”
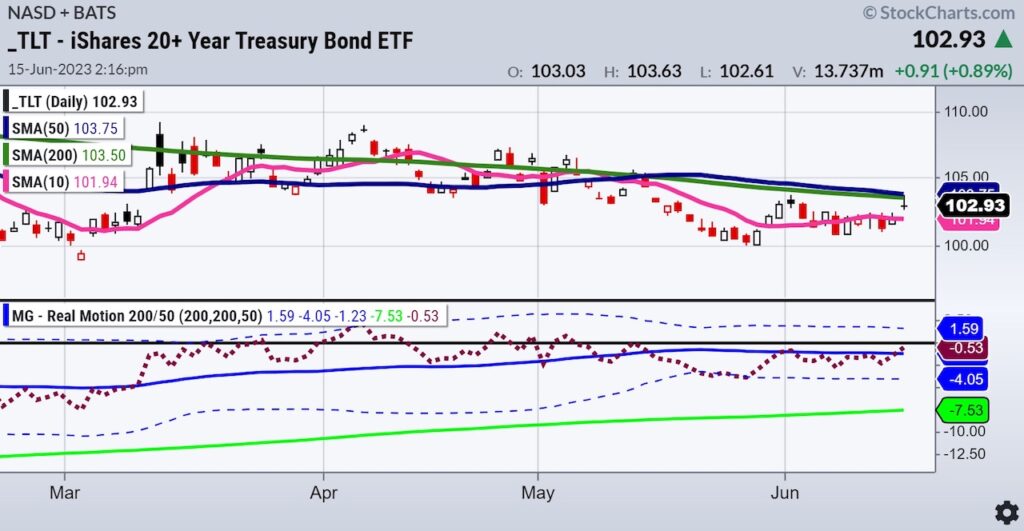
The chart is fascinating.
TLTs ran right up to 2 major moving averages, the 50-DMA (blue) and the 200-DMA (green).
The Real Motion Indicator is now a bullish divergence pattern as the red dots cleared the 50-DMA.
All the while, the indices enjoyed the rally that continued Thursday-although small caps were dragged along more for the ride.
Keep your eyes on the long bonds.
Should TLTs clear and confirm over the moving averages, we might see a shift in the risk gauges.
However, to see a shift in risk, the S&P 500 would also have to either stop rallying and consolidate or begin to drop from current levels.
Of course, if the TLTs head lower and the S&P remains strong, risk on until further notice.
And, we are documenting all of this so you can know what to look at and what to prepare for.
Stock Market ETFs Trading Analysis & Summary:
S&P 500 (SPY) 440 clears-14 month high now-comments on risk in this Daily should help what to look for
Russell 2000 (IWM) 23-month MA 193 still a bit away
Dow (DIA) 34,000 in the Dow now pivotal
Nasdaq (QQQ) 370 target really close
Regional banks (KRE) 42 support, 44 pivotal
Semiconductors (SMH) 150 now major support.
Transportation (IYT) 237 area the 23-month moving average-one place that really makes us believe things are better than ok
Biotechnology (IBB) 121-135 range
Retail (XRT) Back over the 200-DMA and again, needs to confirm and end the week above it
Twitter: @marketminute
The author may have a position in mentioned securities at the time of publication. Any opinions expressed herein are solely those of the author and do not represent the views or opinions of any other person or entity.

: Worrisome to Broader Market?")

