Spot Gold prices and the SPDR Gold Shares Fund (NYSEARCA:GLD) have been hit very hard in the post-election day trade. This trade has also coincided with a rising dollar and equities – 2 potential headwinds for Gold.
But U.S. equities and the greenback have risen sharply in recent weeks and may be in line for a pit stop. That would likely help to slow (or even provide support for) falling Gold prices.
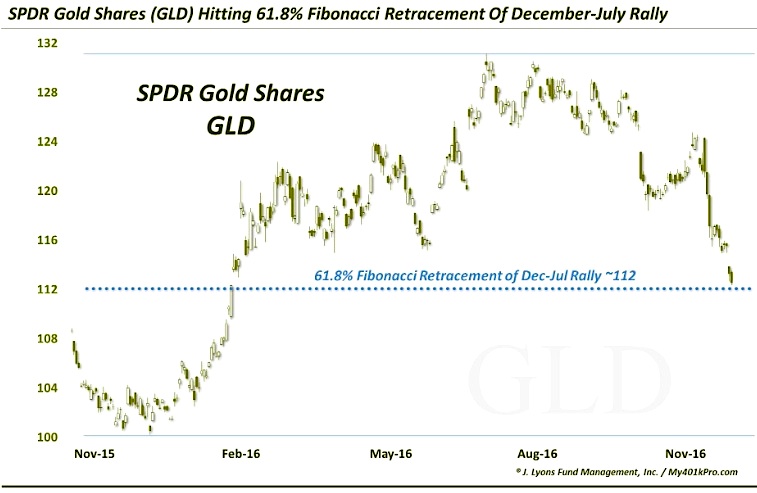
But perhaps the the biggest support for falling gold prices right now is a key technical support level. When looking at the Gold ETF (GLD) chart below, you can see how important Fibonacci levels have been… and the current gold fibonacci support level is a big one.
Here’s a review of the chart below.
- The SPDR Gold Shares Fund (GLD) rallied over 30% off of its 6-year low of last December into its July top at 131.
- It has pulled back since then, getting hit particularly hard in the post-election “Trump Trade” as it dropped nearly 10% in just the last few weeks.
- After breaking most trendlines, key moving averages and other such potential support, GLD is now nearing a 61.8% Gold Fibonacci Support (retracement) of its December-July rally. This may be the gold bugs’ last best chance to halt the decline.
Thanks for reading.
Twitter: @JLyonsFundMgmt
The author does not have a position in mentioned securities at the time of publication. Any opinions expressed herein are solely those of the author, and do not in any way represent the views or opinions of any other person or entity.


