It’s been a little bit gloomy for investors lately. Stocks have chopped lower since peaking 3 months ago and volatility has perked up recently.
Unsurprisingly, we are seeing this deterioration showing up across several key stock market sectors. And unless we see major improvement, it could be tough sledding ahead.
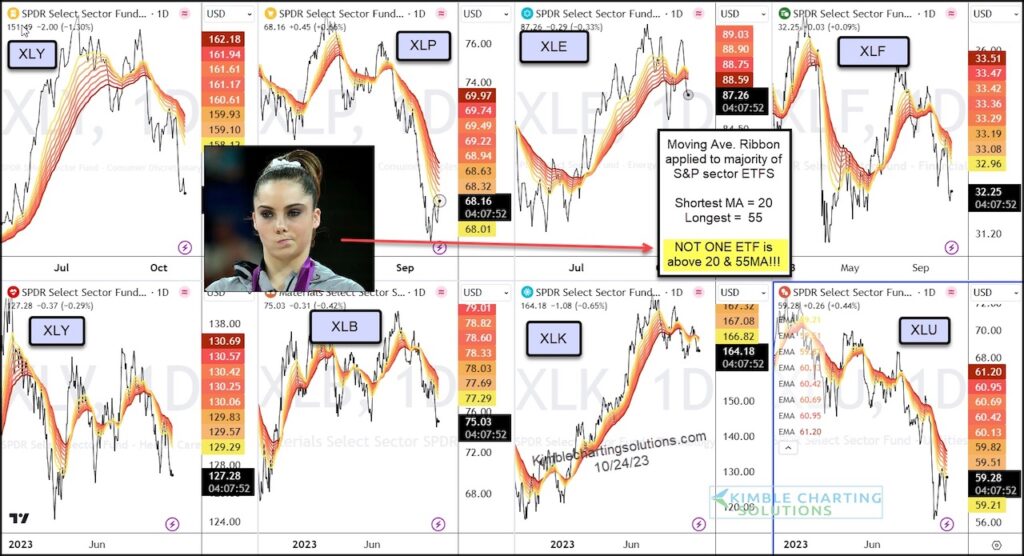
Below is a chart 8-pack of key S&P Sector ETF’s. As you can see, many sectors are technically bearish.
Some are clearly worse off than others, but all 8 of these sectors are all trading below the moving average ribbon, a series of moving averages (shortest 20-day, longest 55-day).
Clearly, this is not sending an impressive message from a moving average perspective. Bulls definitely have their work cut out for them. Stay tuned!
Chart 8-pack: S&P Sector ETFs
Note that KimbleCharting is offering a 2 week Free trial to See It Market readers. Just send me an email to services@kimblechartingsolutions.com for details to get set up.
Twitter: @KimbleCharting
Any opinions expressed herein are solely those of the author, and do not in any way represent the views or opinions of any other person or entity.


