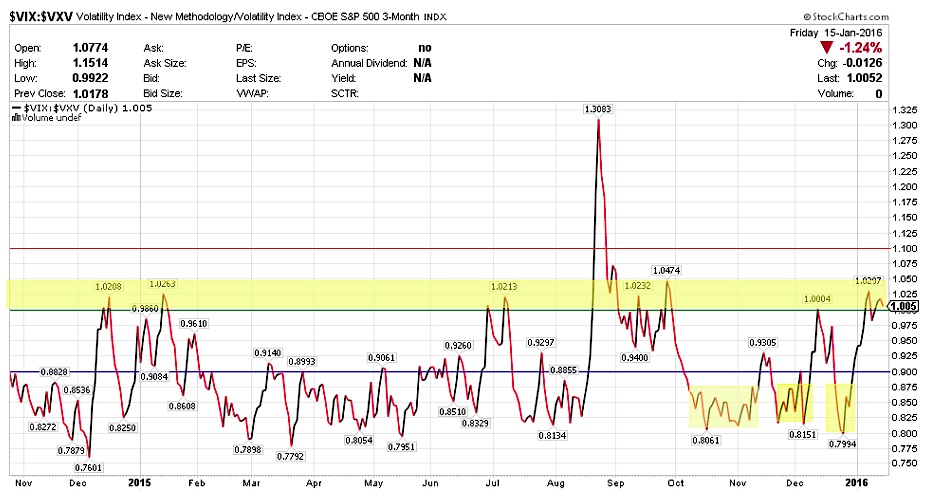
$VIX:$VXV:
$VXV is the 3 month volatility index. The relationship between $VXV and $VIX (30 day volatility) or the ratio between them if > 1.00 often spells trouble for stocks.
This ratio spiked again over 1.00 and finished the week at 1.005. It is still elevated so a reversal is possible. But if this goes higher, that can spell trouble for the stock market as a whole (while indicating a lot of fear).
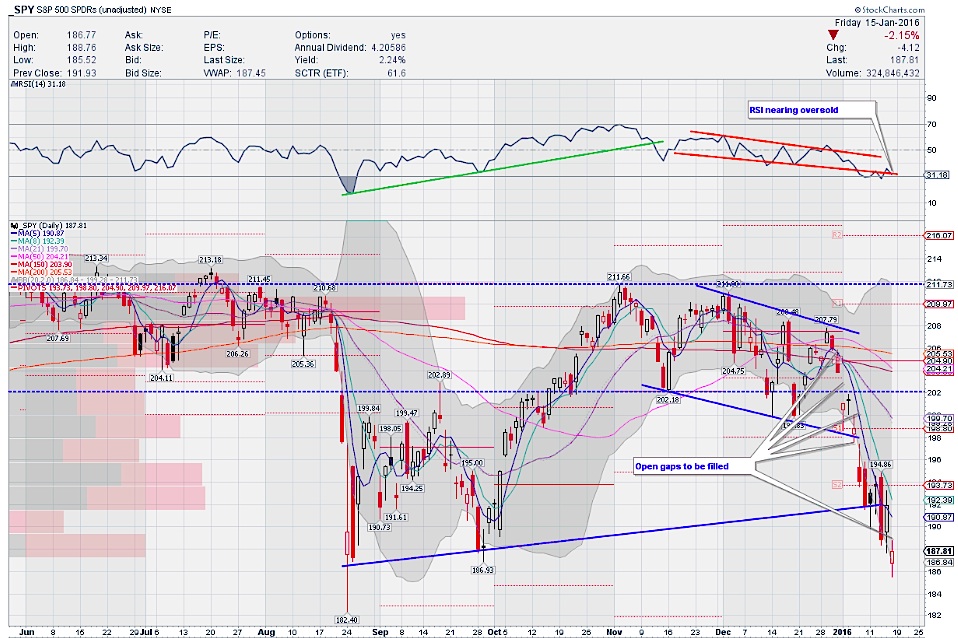
$SPY DAILY TIMEFRAME:
The S&P 500 (SPY) finished the week by printing a Doji candlestick (a classic sign of indecision). And volume for this stock market decline is running near the August stock market correction volumes.
$SPY is currently below all moving averages. I am watching 185 as a potential bounce level. Caution though. And do not over stay your welcome.
RSI is below the median in the bearish zone but just a tad above the oversold markets zone. MACD continues to fall and is well below median. Slow STO is embedded and seen crossing lower in the oversold markets embedded zone. Not a great sign either. More downside with a possibility of a dead cat bounce.
S&P 500 ETF (SPY) Chart – Will oversold markets become more oversold?
You can read more of my weekly analysis on my website. Thanks for reading and have a great week.
Twitter: @sssvenky
The author has a position in S&P 500 related securities. Any opinions expressed herein are solely those of the author, and do not in any way represent the views or opinions of any other person or entity.


 Showing Bullish Buy Potential")


