Just 2 weeks into the new year and it already feels like an entire year of trading has passed. The price action has been brutal, with bears taking the lead. Oversold markets have become more oversold.
Market breadth is horrendous although some small divergences are creeping in and highlighting a chance for a very short-term bounce which has a lower likelihood of sticking
Fear is showing up everywhere with Equity-Only Put call ratio and CBOE Volatility Index (VIX) beginning to move higher. Highly correlated market action with crude oil pushing lower while China continues to devalue its currency. Global Economies are likely on the brink of recession as oversold markets become more oversold.
Every major stock market index in the world is now trading below its 200-day moving average. News headlines are beginning to bring up 1987 and 2008, with many calling it a bear market and a few still a market correction. Note that a stock market correction is 10-12% or so while a bear market for stocks is 20% or more.
To me price action is more important and I only care about the implications of the next movement in price whichever way it goes. To be honest, many stocks as I see are already in their Bear Market territories. The only major US stock market index in a bear market is the Russell 2000 Index (RUT).
It appears that the markets are pricing in much worse than we can see just now. But as I have stated, oversold markets can become more oversold. That’s the persistence of a crash-like state.
Let’s delve in to the details including breadth indicators.
Economic Calendar:
The key Economic Reports for the short week include:
- Wednesday: Consumer Price Index and Housing Starts
- Thursday: Jobless Claims, Philly Fed Business Outlook Survey and EIA Petroleum Status Report
- Friday: PMI Manufacturing Index Flash, Existing Home Sales and Leading Indicators
Market Breadth Indicators:
As you may have seen me post last 2 weeks, we’re oversold on many fronts with respect to Breadth Indicators. However, oversold can remain oversold for an extended period of time. Having said that, the biggest and fastest moves upwards do occur during corrective phases or even bear markets.
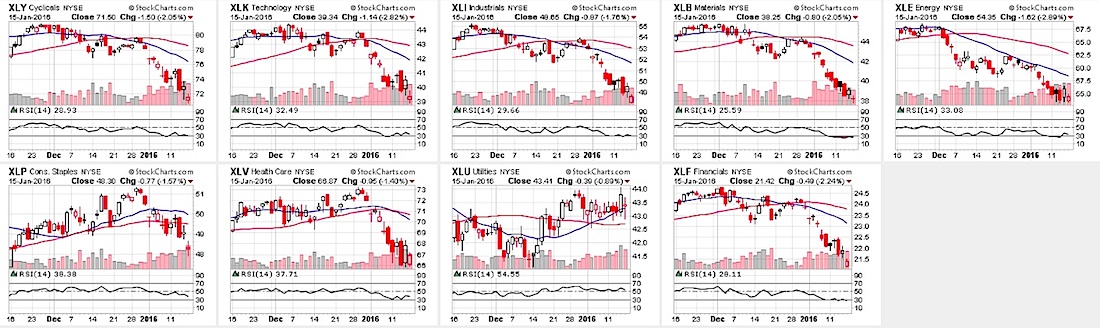
Sector Performance:
Here’s a look at the main S&P 500 sectors with respect to their Relative Strength Index readings (RSI). 5 out of 9 sectors are oversold. 3 of them are nearing oversold. Oversold markets can remain oversold… but the possibility of a bounce in stocks over the near term is growing.
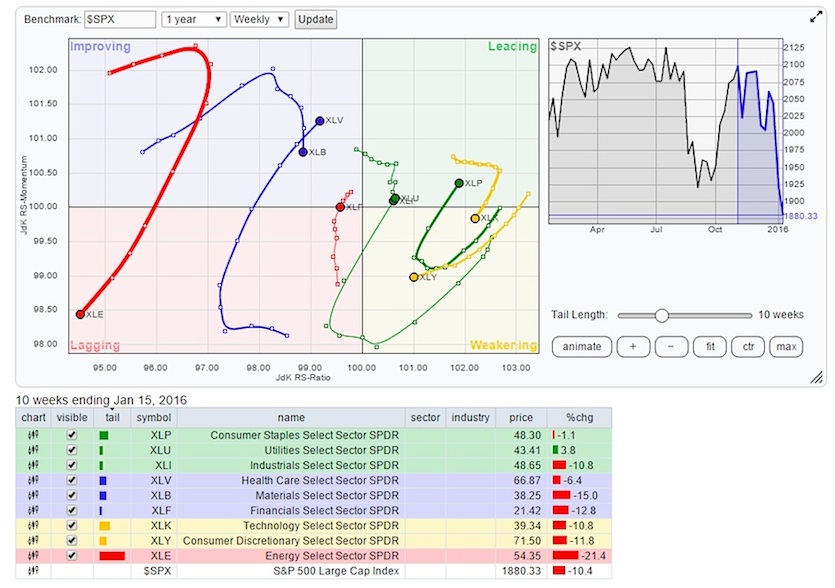
The Relative Rotation Graph (RRG) chart shows sector leaders and laggards.
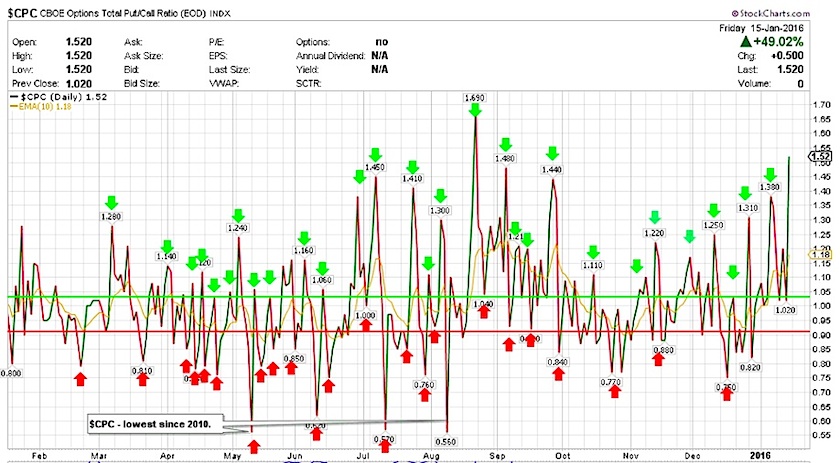
$CPC – Put/Call Ratio:
The CBOE Options Total Put/Call Ratio – $CPC has spiked to 1.52. The levels are higher than the December, October and September levels with only the August stock market correction level being higher. It is certainly elevated here and nearing a spot where it can reverse over near-term.
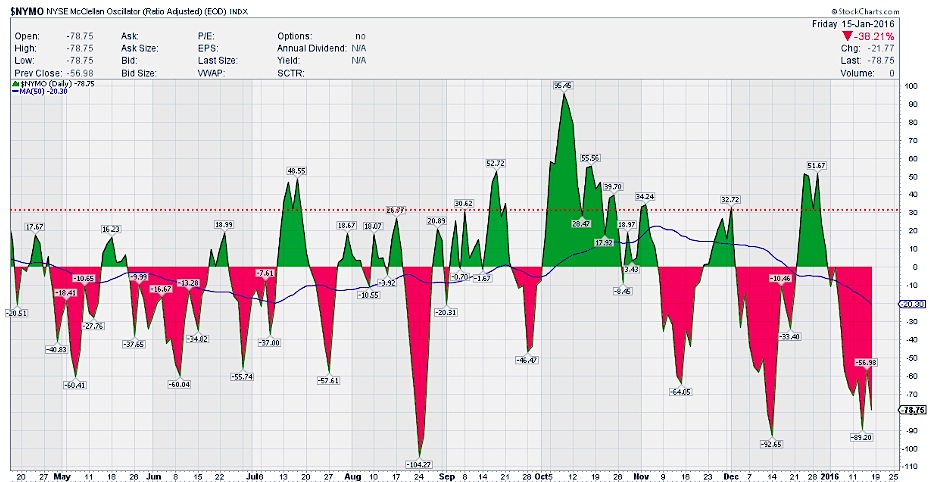
$NYMO (McClellan Oscillator):
After getting to -96 on Wednesday, the McClellan Oscillator ($NYMO) finished the week at =78.75. It hit -89 intraday on Friday, indicating that all was not well into the holiday weekend. While I would like to say that a bounce is coming, oversold markets have a way of remaining oversold and caution is warranted even if we get a bounce in the stocks.
continue reading on the next page…


 Showing Bullish Buy Potential")


