In this week’s investing research outlook, we examine current trends for the S&P 500 Index (INDEXSP:.INX), while checking in on stock market breadth and investment fund flows. We’ll also discuss current investing themes and news that we are watching in the financial markets.
Here’s our summary of our findings for the week ending December 1, 2017:
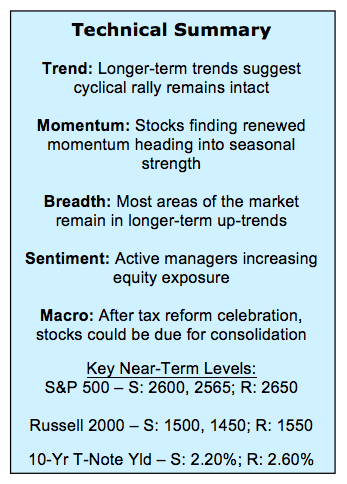
Leadership Groups Break Out To New Highs – The popular averages finished November on a strong note, as the S&P 500 posted its 8th consecutive monthly gain. The latest move to new highs comes with notable strength from areas that are typically seen as leading indicators. The Dow Transports are confirming the highs being made by the Dow Industrials, and the Broker/Dealer index is making new highs on an absolute and relative basis.
Individual Stocks Confirming Index-Level Strength – Strength extends beyond these indexes. Our sector-level trend indicator has surged in recent weeks and the percentage of stocks trading above their 50-day and 200-day averages has turned sharply higher. We are also seeing an expansion in the number of stocks making new highs of their own.
Equity Funds Attract Inflows – After struggling to attract inflows for much of 2017, equity funds are now seeing dollars head their way. The pattern over the past few years is that when this finally happens, stocks tend to struggle. Add in the widespread complacency seen in the put/call ratios and the excessive optimism reading from the NDR Trading Sentiment Composite, and stocks could be due for pause ahead of an expected year-end rally.
Stock Market Indicators

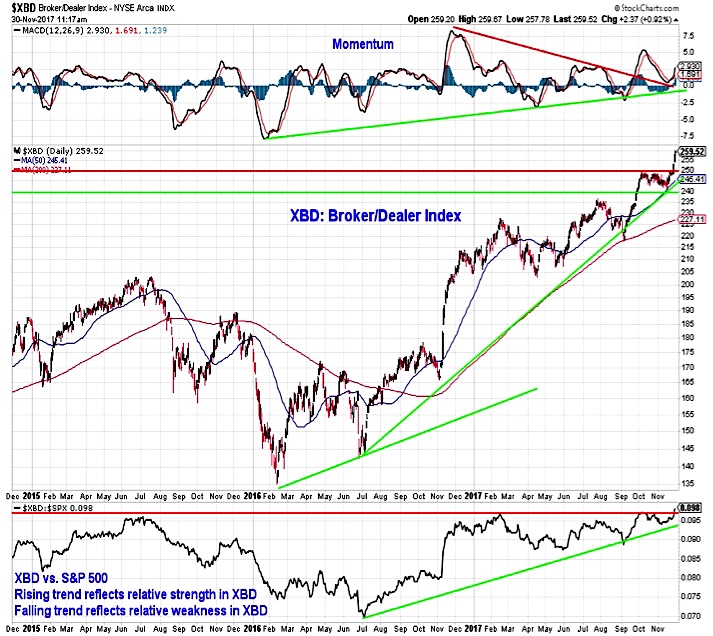
Broker/Dealer Index
The Broker/Dealer index has been trending higher on an absolute since it bottomed in early 2016. This has come on waning momentum since the late-2016 surge, and the relative price has been unable to make much headway this year. That appears to be changing now. The momentum up-trend is re-asserting itself after breaking through and then re-testing the down-trend that emerged late last year. The relative price line has moved to a new high this week as the Broker/Dealer index is leading the S&P 500 to new all-time highs.
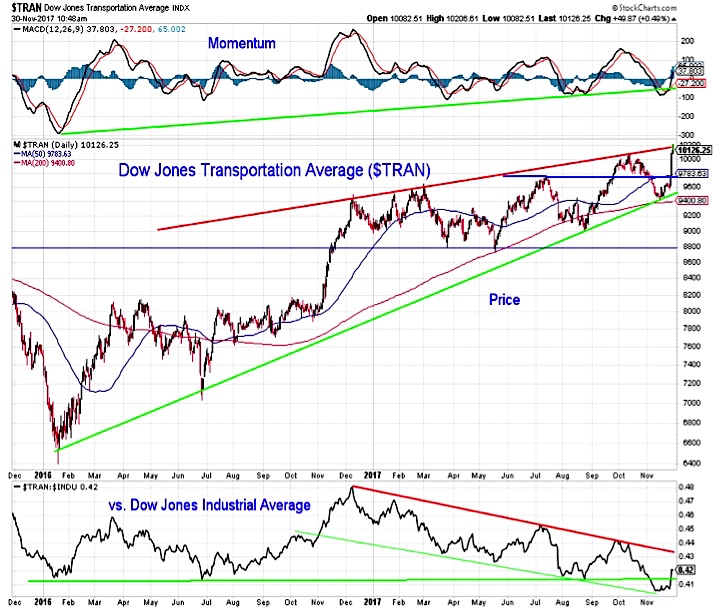
Dow Transportation Average
After a mid-month test of its 200-day average, the Dow Transports have shown remarkable resiliency and moved to new all-time highs this week. This confirms the new highs being set on the Dow Industrials. While the Transports remain in a relative price down-trend versus the Industrials, the ratio has turned higher on a short-term basis, and Transports could continue to provide some near-term leadership.
Market Breadth
Two weeks ago we expressed concern about some deterioration being seen at the individual stock level. While not totally assuaged, that concern has been lessened as the percentage of stocks trading above their 200-day average and 50-day average has expanded sharply over the second half of November. The percentage of stocks trading above their 50-day averages has surged from 57% to 76% and now just exceeds the percentage trading above their 200-day average. With three-quarters of the stocks in the S&P 500 trading above their 50-day average, it is hard to make the case that strength in the index is due to just a handful of Technology stocks.
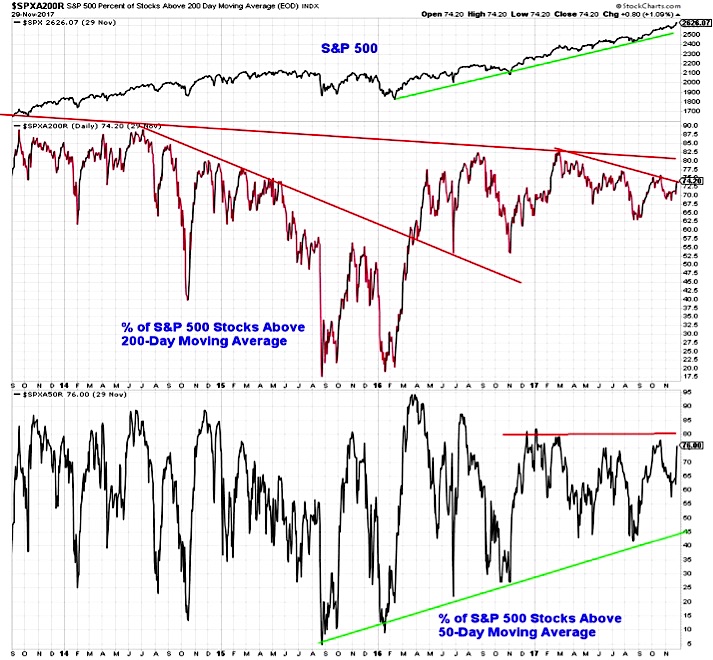
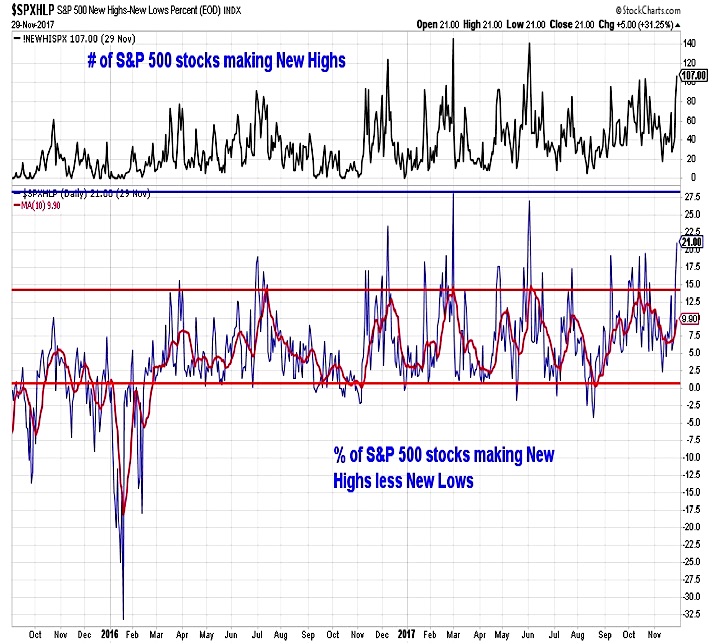
Individual stocks are increasingly joining the indexes in making new highs as well. Yesterday more than one in five S&P 500 stocks made new 52-week highs, and on a net basis (new highs less new lows) this was the best showing in the second half 2017.
Sector-level trends have also improved and there, too, the new high list is expanding. This week, five of nine cap-weighted sector ETF’s have made new 52-week highs, while seven of nine equal-weighted sector ETF’s have done so as well.
continue reading on the next page…


